The GNS3 GUI
Introduction
This document explains various options in the GNS3 Graphical User Interface (GUI) which help you create and manage GNS3 projects.
This guide applies to both the Local Server and GNS3 VM installations. Both installation options use the same user interface for the management of projects.
Screen Layout
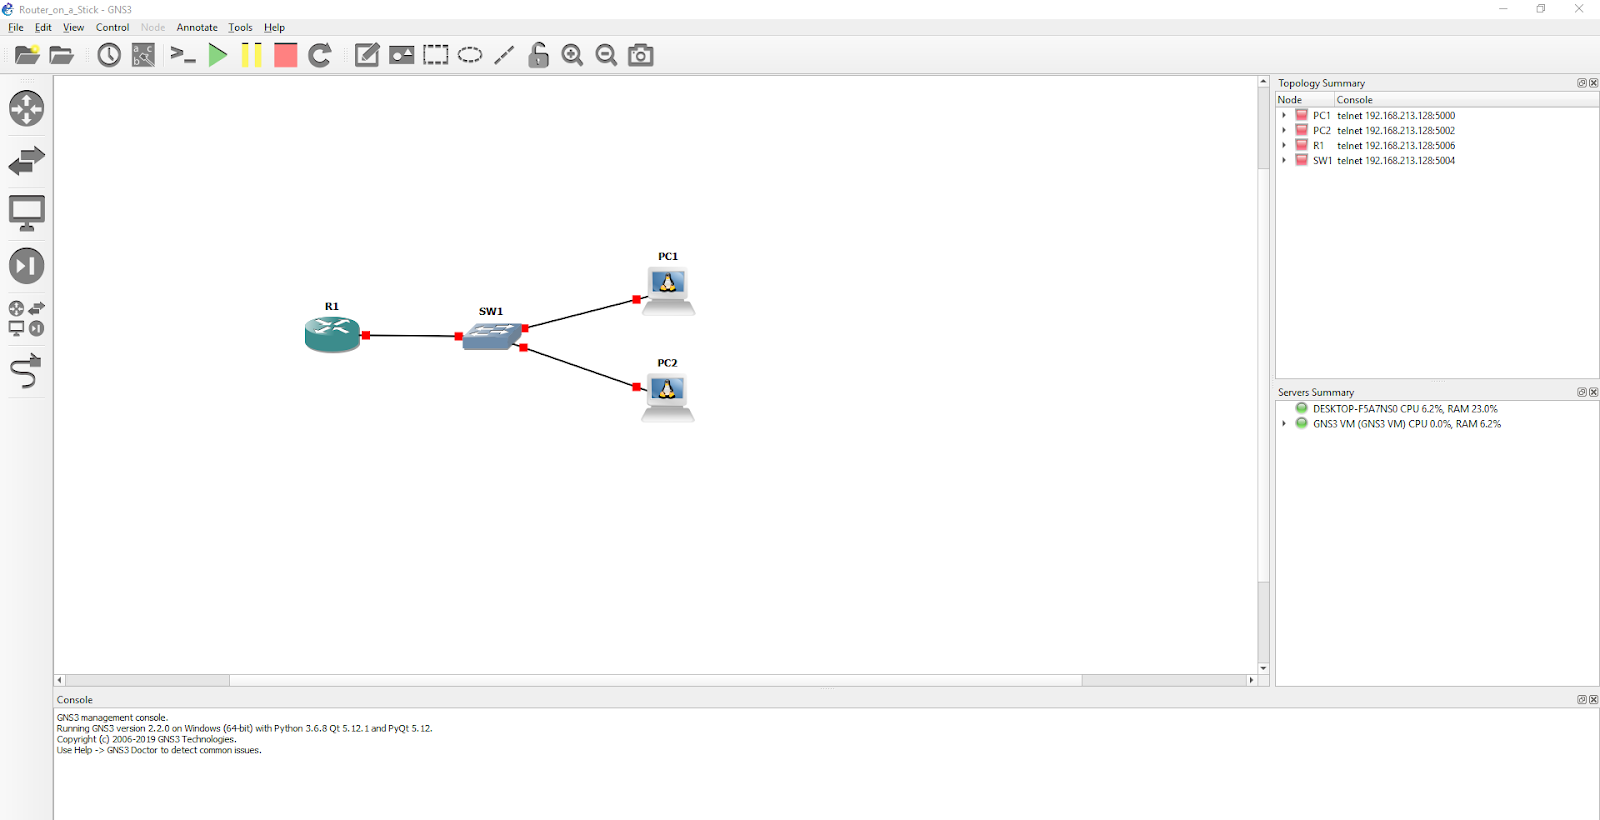
The following figure shows a screenshot of the version 2.2.0 GNS3 GUI:
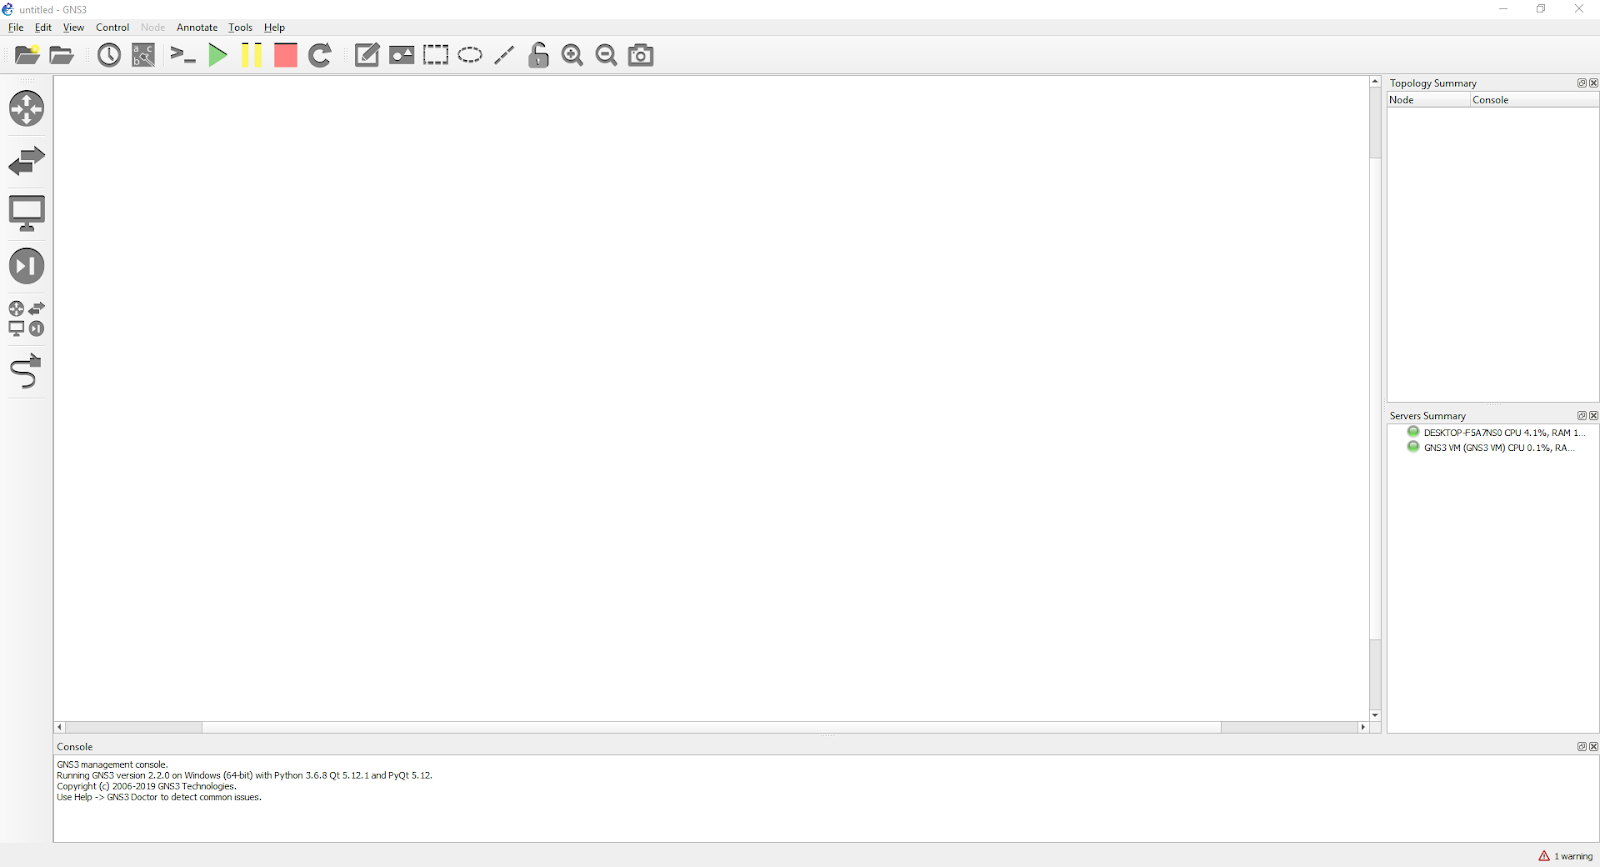
The GUI is subdivided into several sections: The Workspace, Toolbar, Devices Toolbar, Topology Summary, Servers Summary, and the Console.
GNS3 Workspace
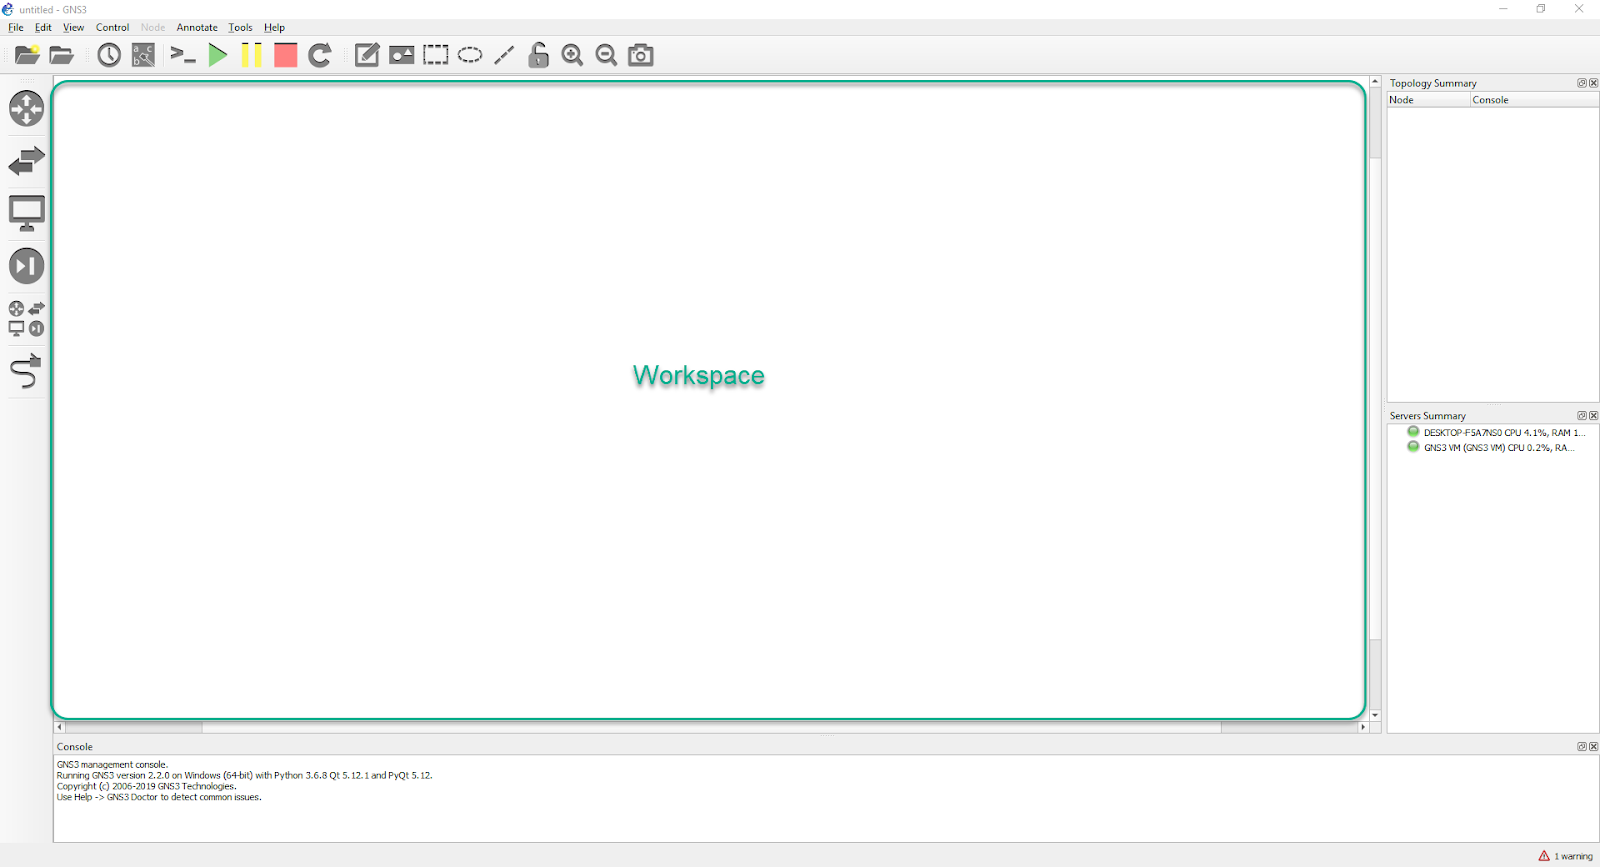
The Workspace is where devices will be “dragged and dropped” in order to build your topology.
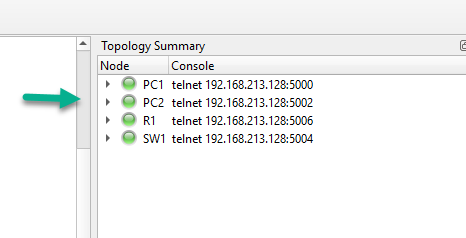
Topology Summary
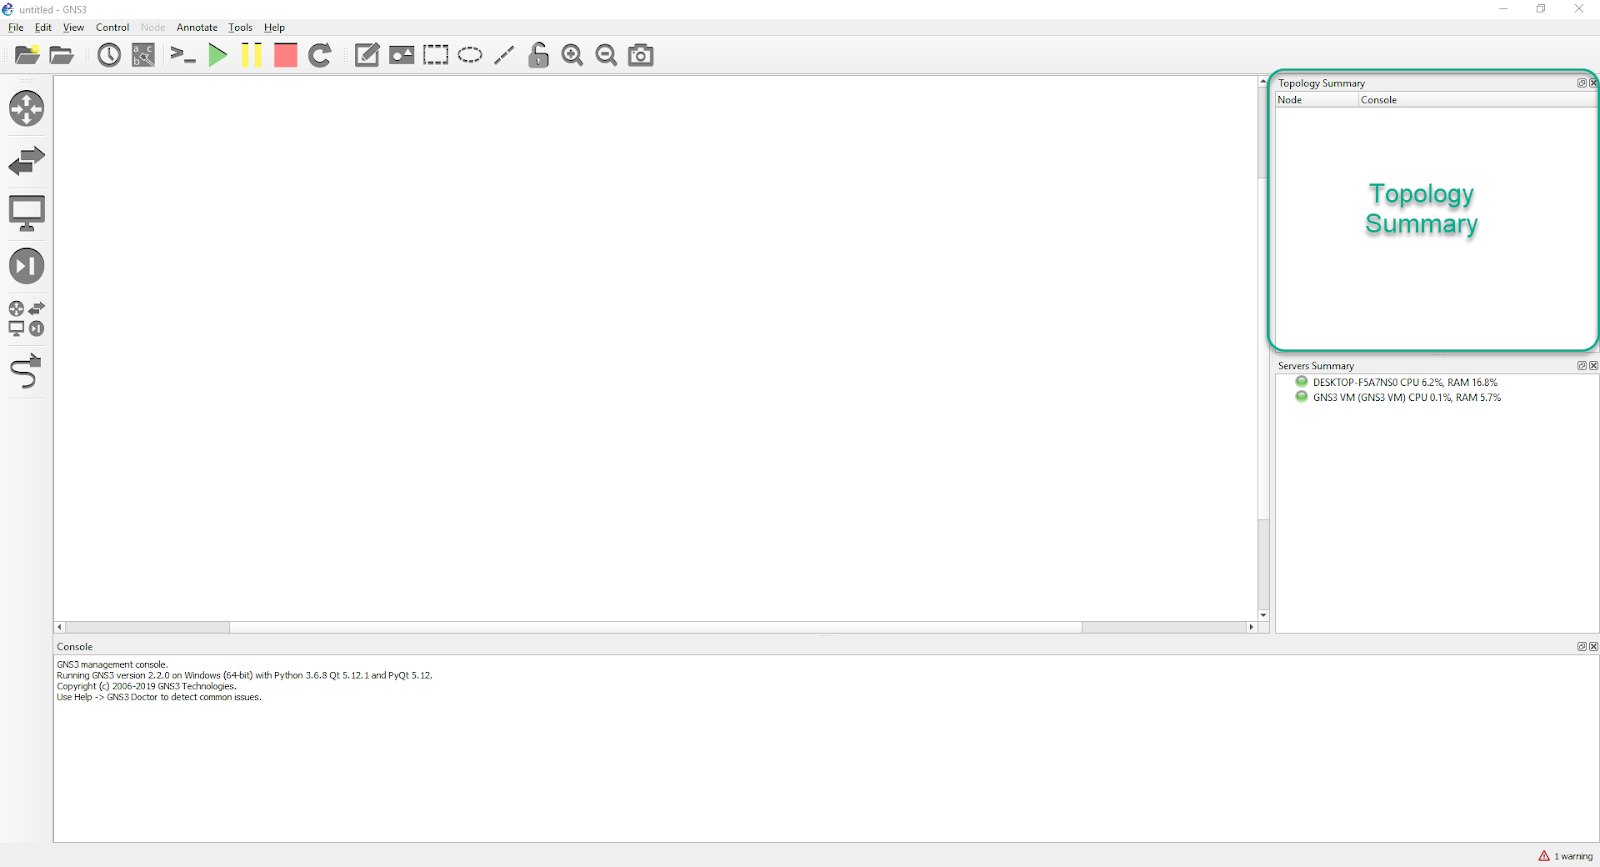
This pane will display devices currently in the Workspace, their status (on/off/suspended), as well as which devices are connected to one another.
Servers Summary
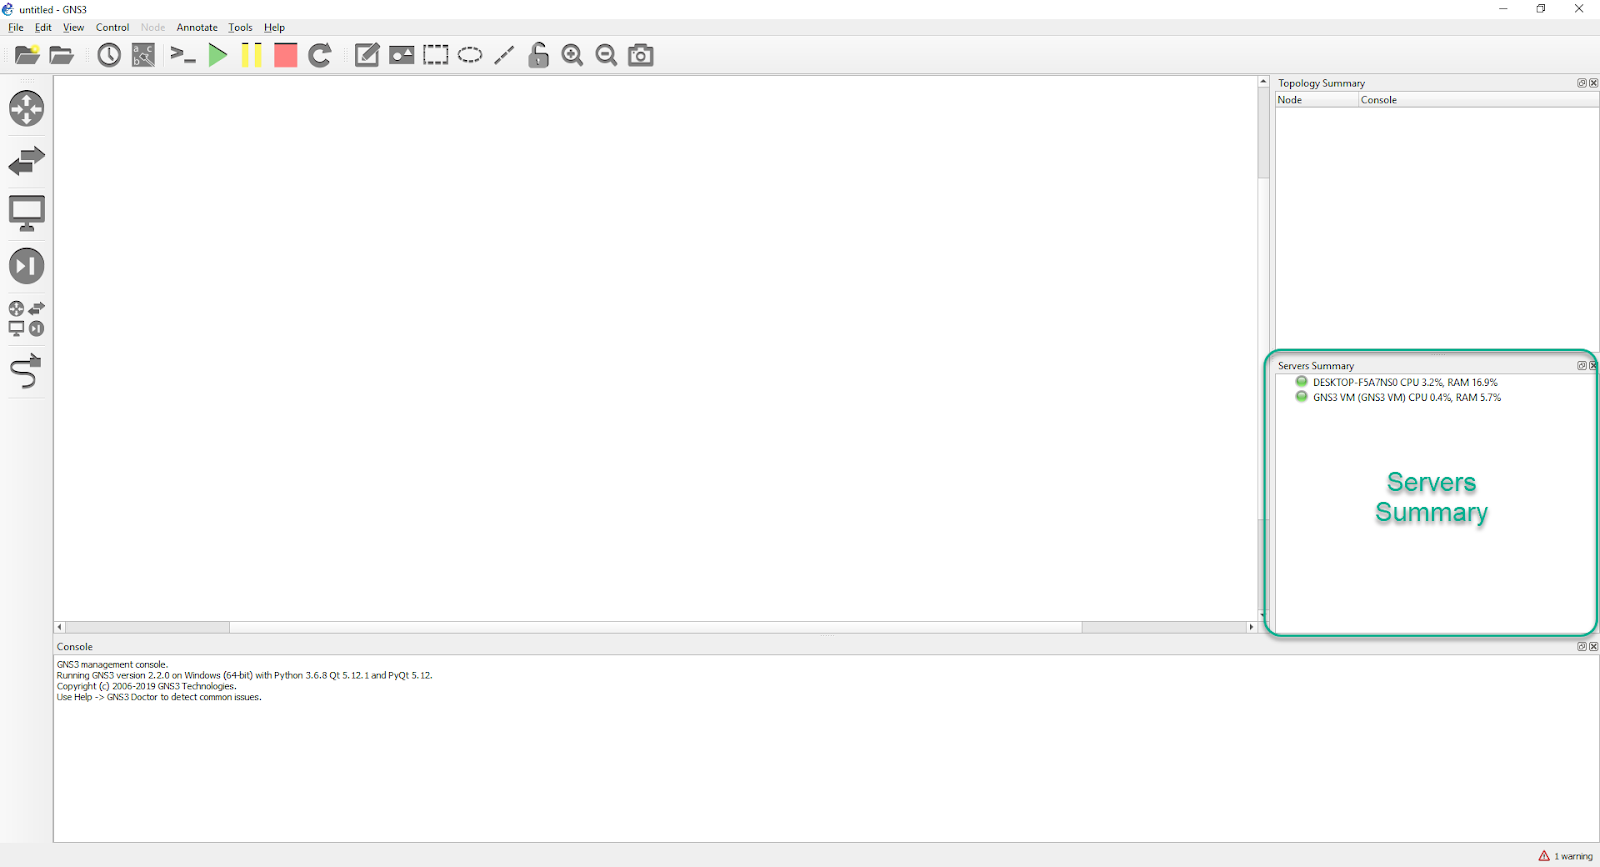
This pane will display the servers in use (local, local GNS3-VM, remote), their state (on/off), as well as their current resource usage. Note that the local server includes statistics for more than just GNS3, so if you’re heavily multitasking, that will be reflected in its reported resource usage.
GNS3 Console
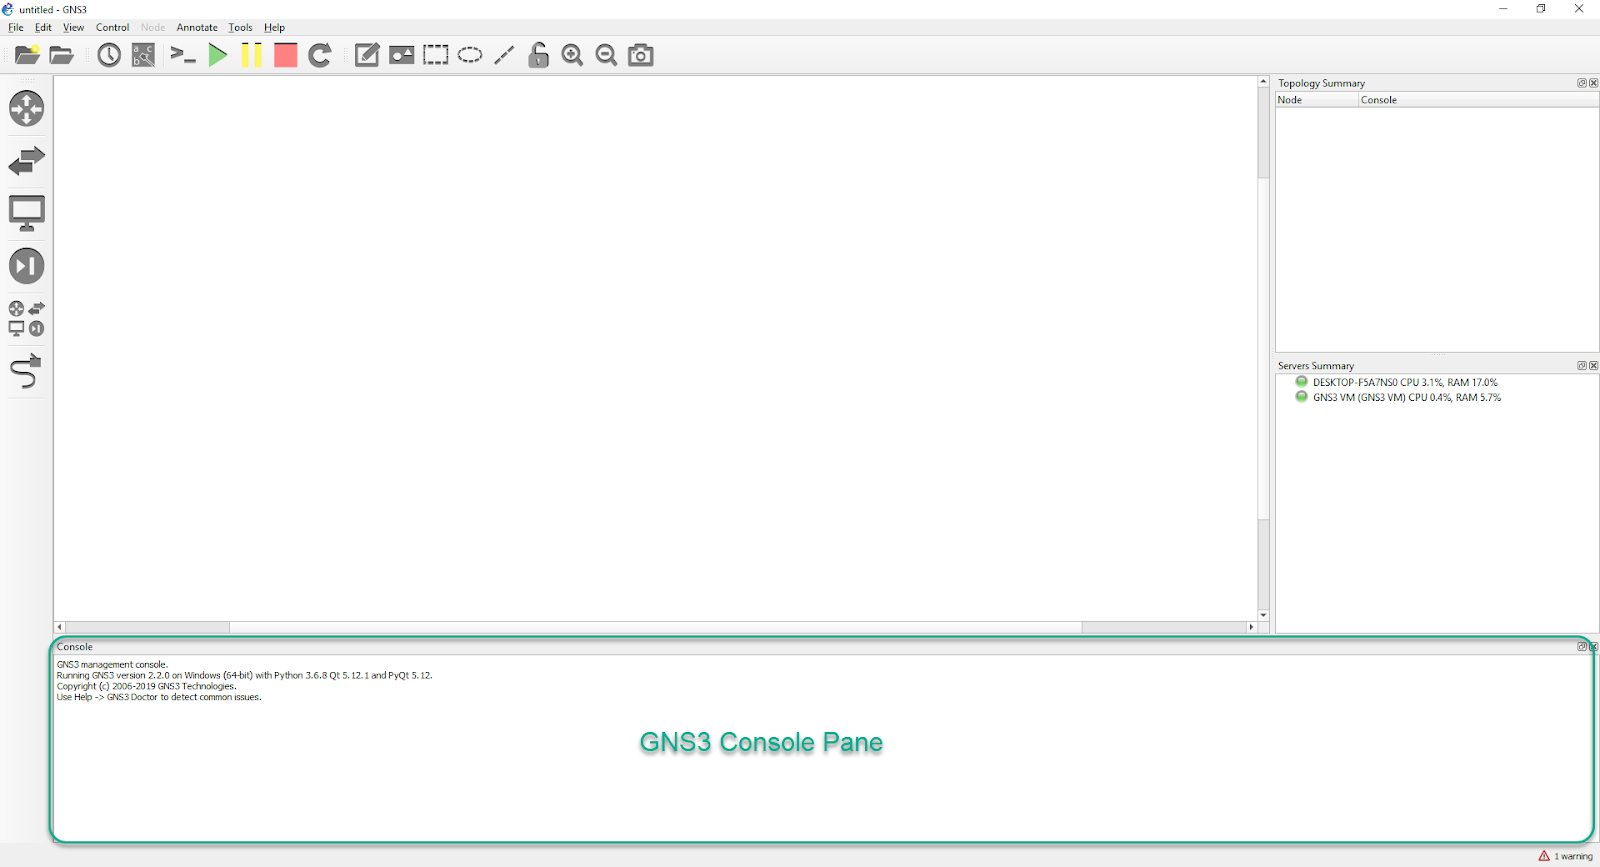
This pane will display any errors/issues GNS3 itself encounters, and will output those messages here. You may be be asked by Moderators or other community members attempting to help you will ask that you report any error messages, as well as potentially run debug commands here for more verbose error output.
Devices Toolbar
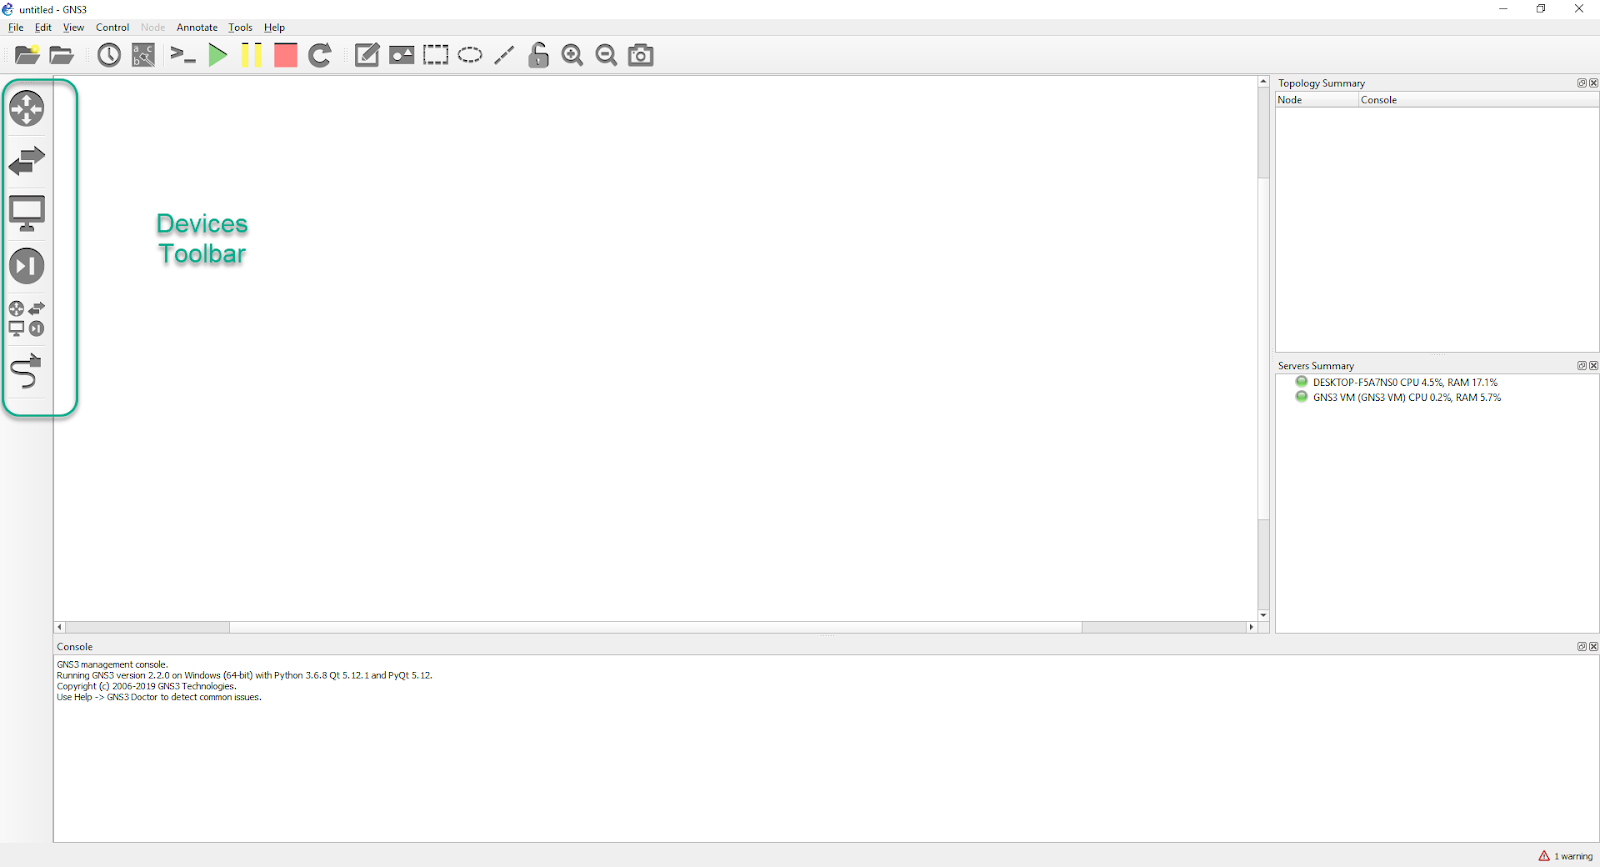
Devices in GNS3 are divided by category, such as Routers, Switches, End Devices, Security, All Devices, along with the Add Link button at the bottom (it looks like a network cable).
GNS3 Toolbar
The GNS3 toolbar found at the top of the GNS3 GUI, contains groups of icons that allow you to easily perform common tasks.
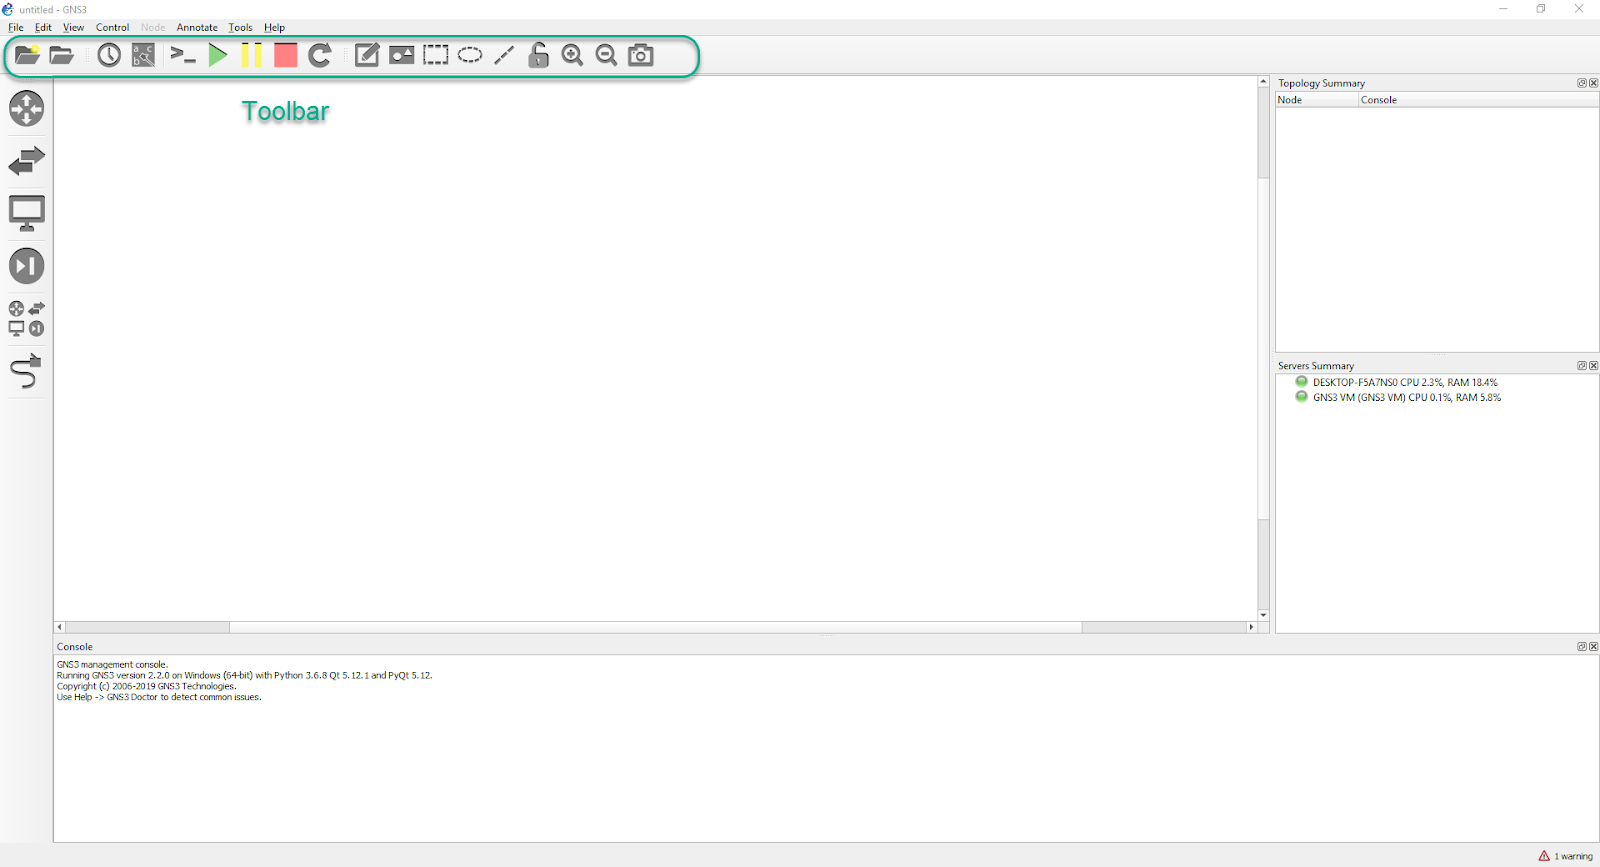
The toolbar groups icons into specific functions or features. This gives you a simple way of getting things done.
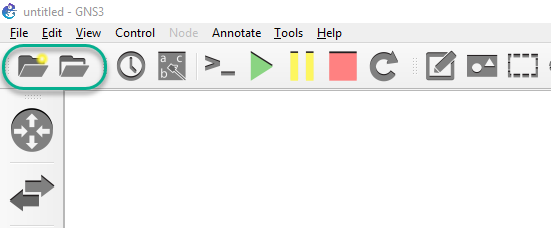
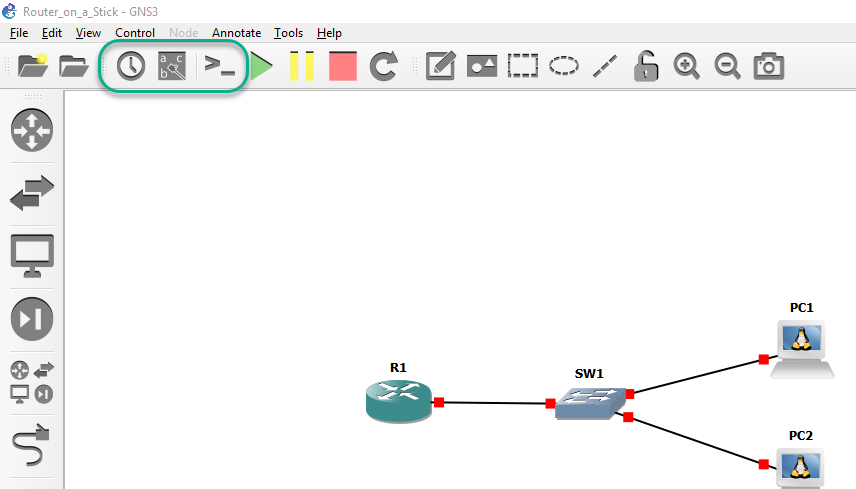
First GNS3 Toolbar Group
The first group allows you to create, open and save projects:
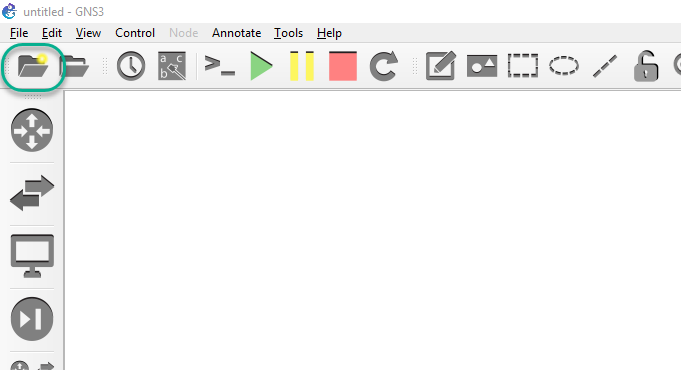
New Blank Project
Click the New Blank Project button to create a new project in GNS3. You will be asked for your new project name and folder to save the new project.
To create a new GNS3 project, click the New Blank Project button on the GNS3 Toolbar:
GNS3 will prompt you for the Name and Location of your new project.The default name is untitled and default location C:\Users\<username>\GNS3 in Windows:
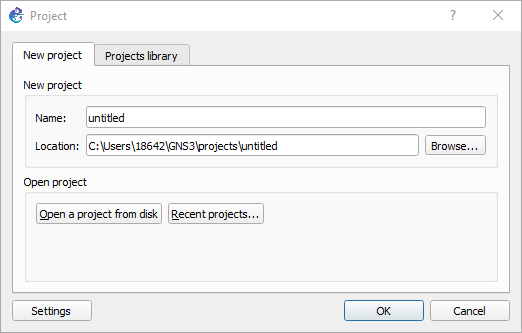
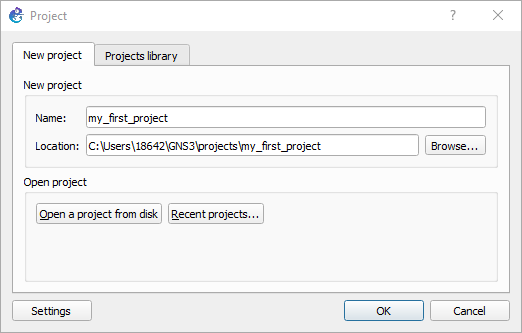
Give your project a name, change the location if desired and click OK
A new project is opened:
Open Project
Click the Open Project button to open an existing GNS3 project. You will be asked for your new project name and folder to save the new project.
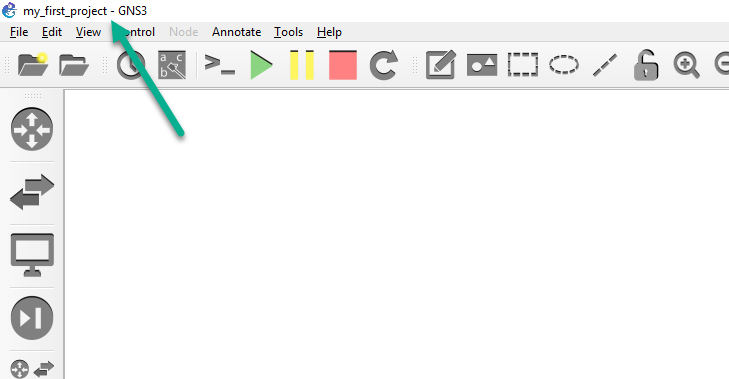
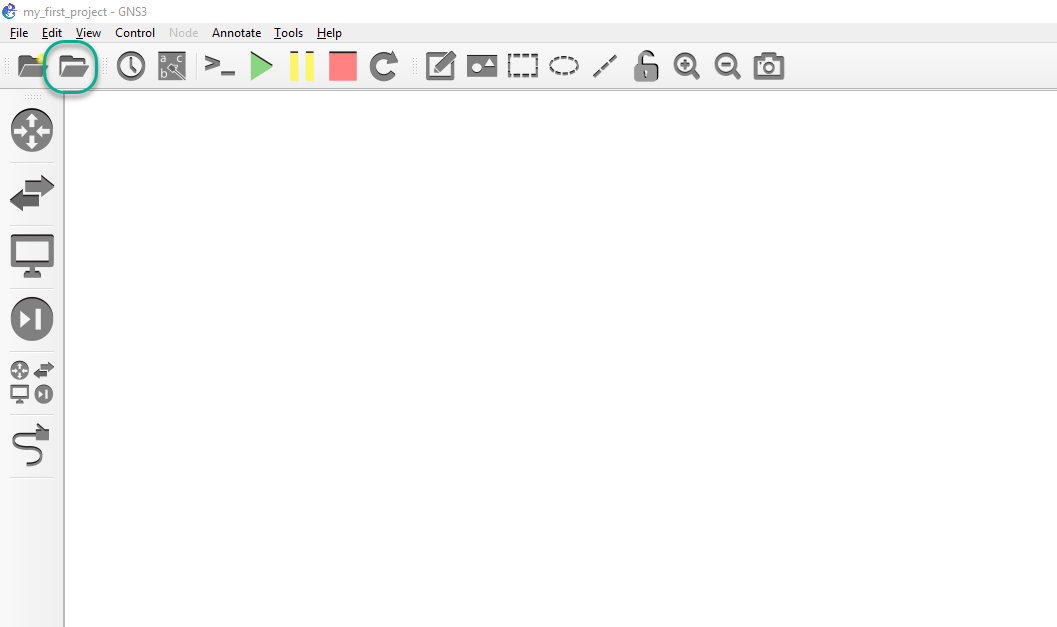
To Open an existing project, click the Open Project button on the GNS3 Toolbar:
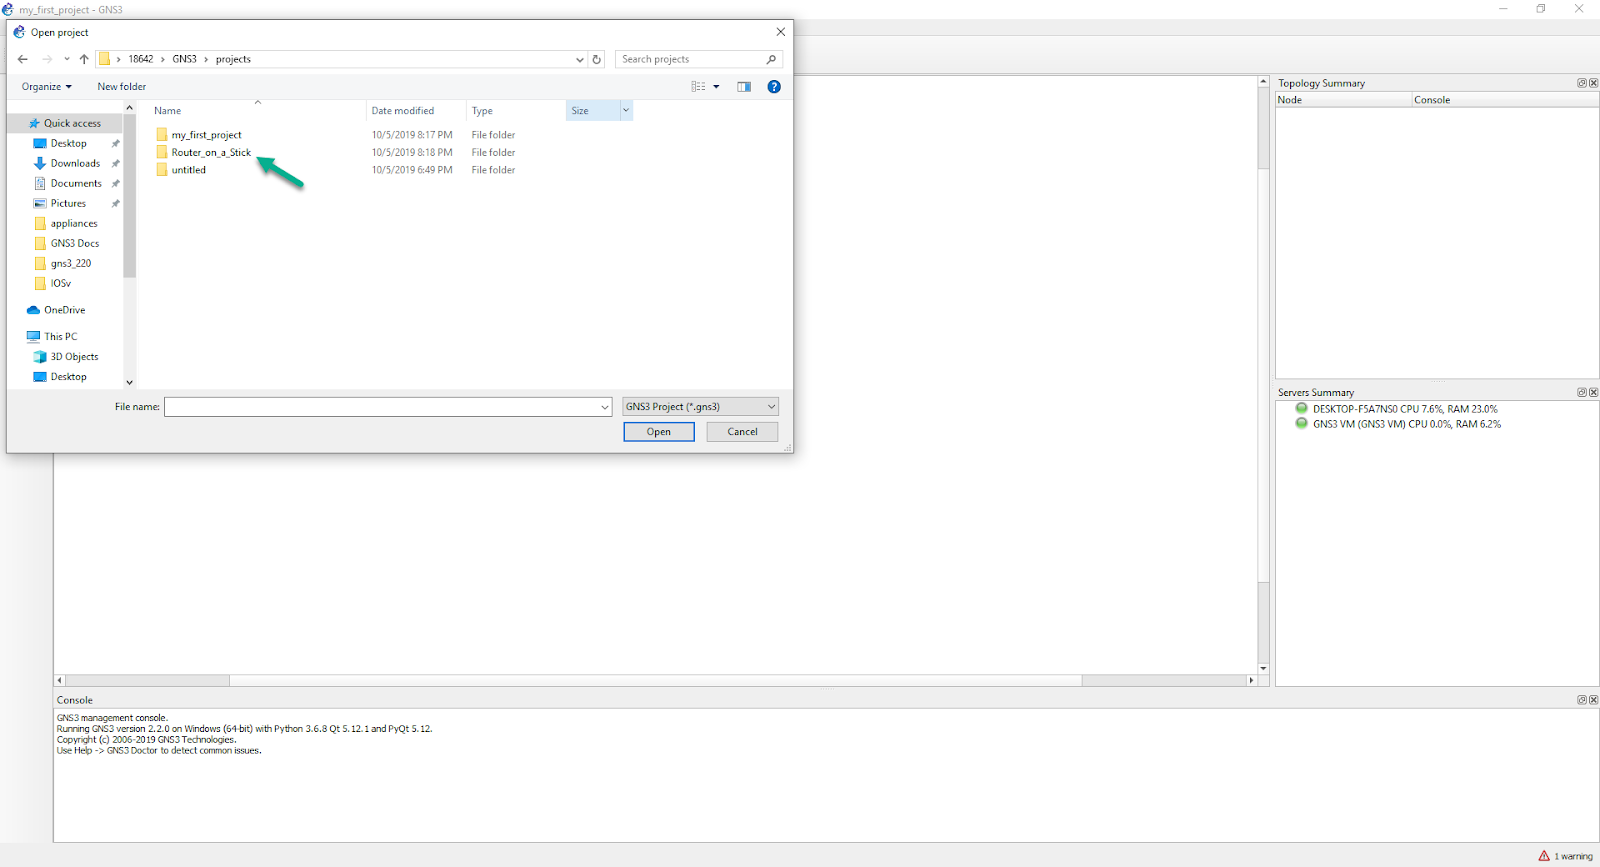
An Open project window will display. Navigate to the GNS3 projects folder. By default this is C:\Users\<username>\GNS3 in Windows:
Select the project file and click then Open
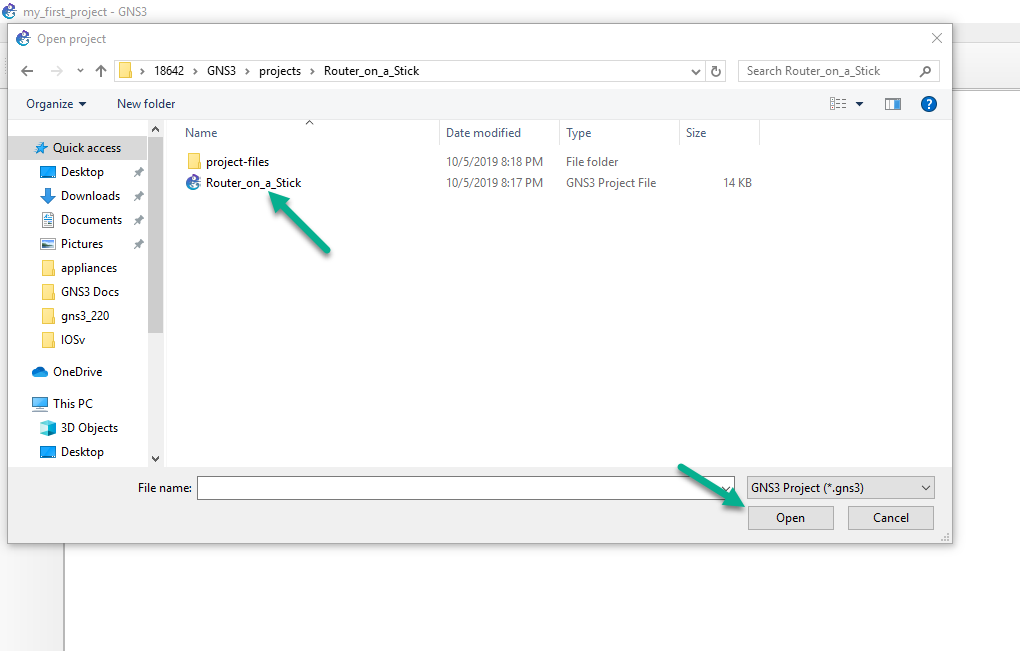
Project files use the .gns3 extension. For example, in the above figure, the name is: ospf-2.gns3
The project is opened with all devices turned off:
(GNS3 now saves as you go, so there’s no longer discrete Save button)
Second GNS3 Toolbar Group
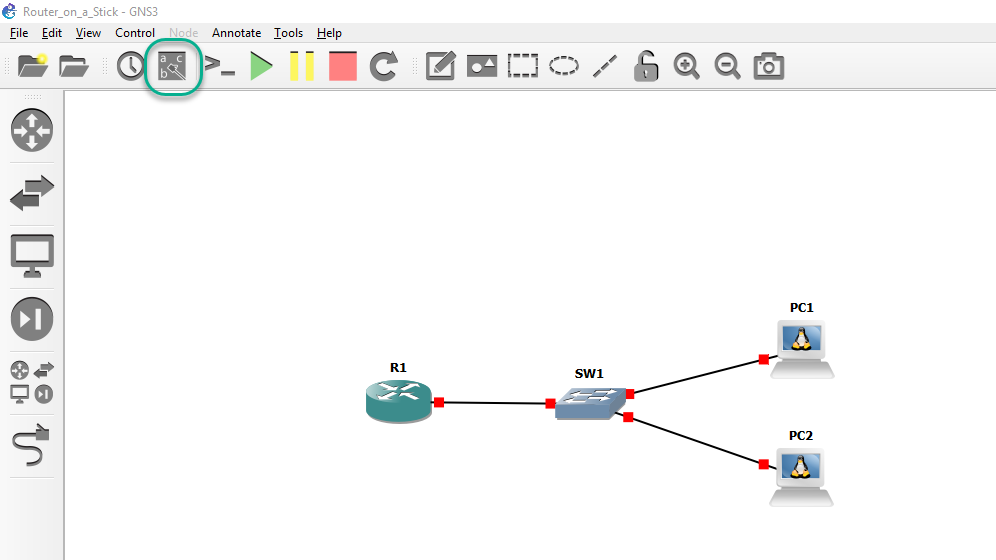
The second GNS3 Toolbar Group allows you to create project snapshots, show or hide interface labels and connect to device consoles:
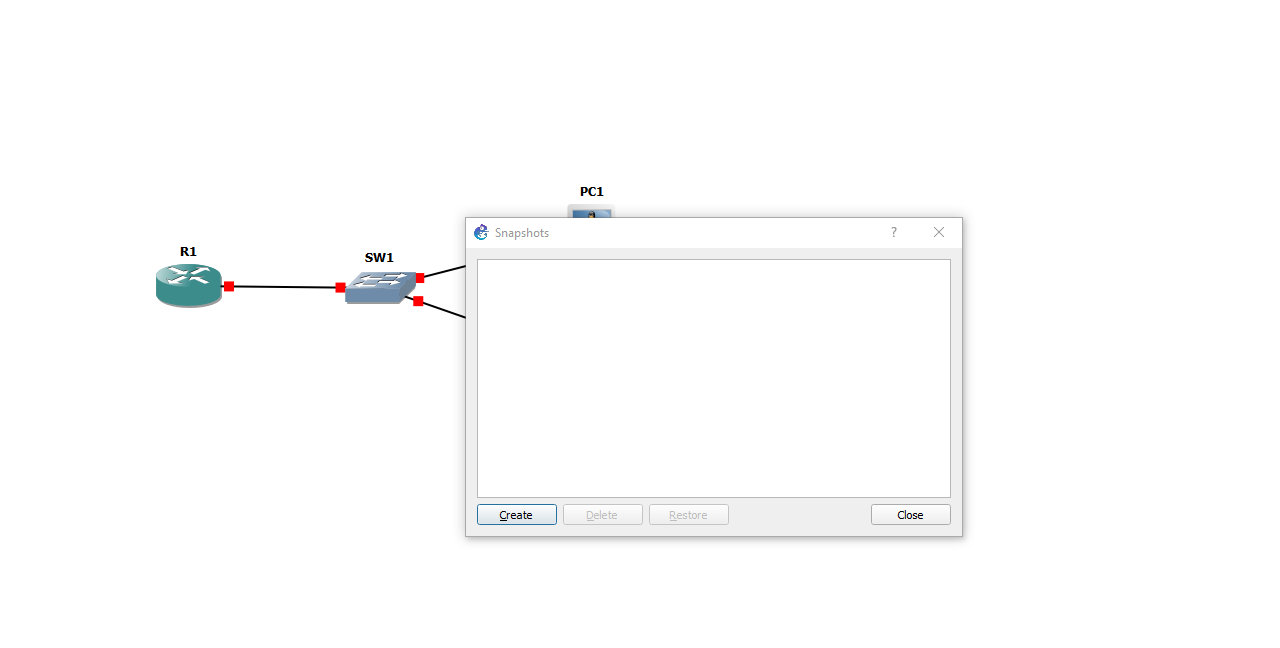
Manage Snapshot
Click the Snapshot button to create a snapshot of your devices, links and IOS configurations. The Snapshots in GNS3 are similar to snapshots in other systems such as VMware which allow you to create a saved version of your project at a specific point in time. You can then revert back to this later.
::: important If you want your router configurations saved, make sure you save them via the router CLI. Clicking the Snapshot button will open a window giving you the options to create/delete/restore a snapshot. :::
To create a new Snapshot of the current topology, all devices in it must first be stopped, so save their configuration changes first in their CLI, then click Create.
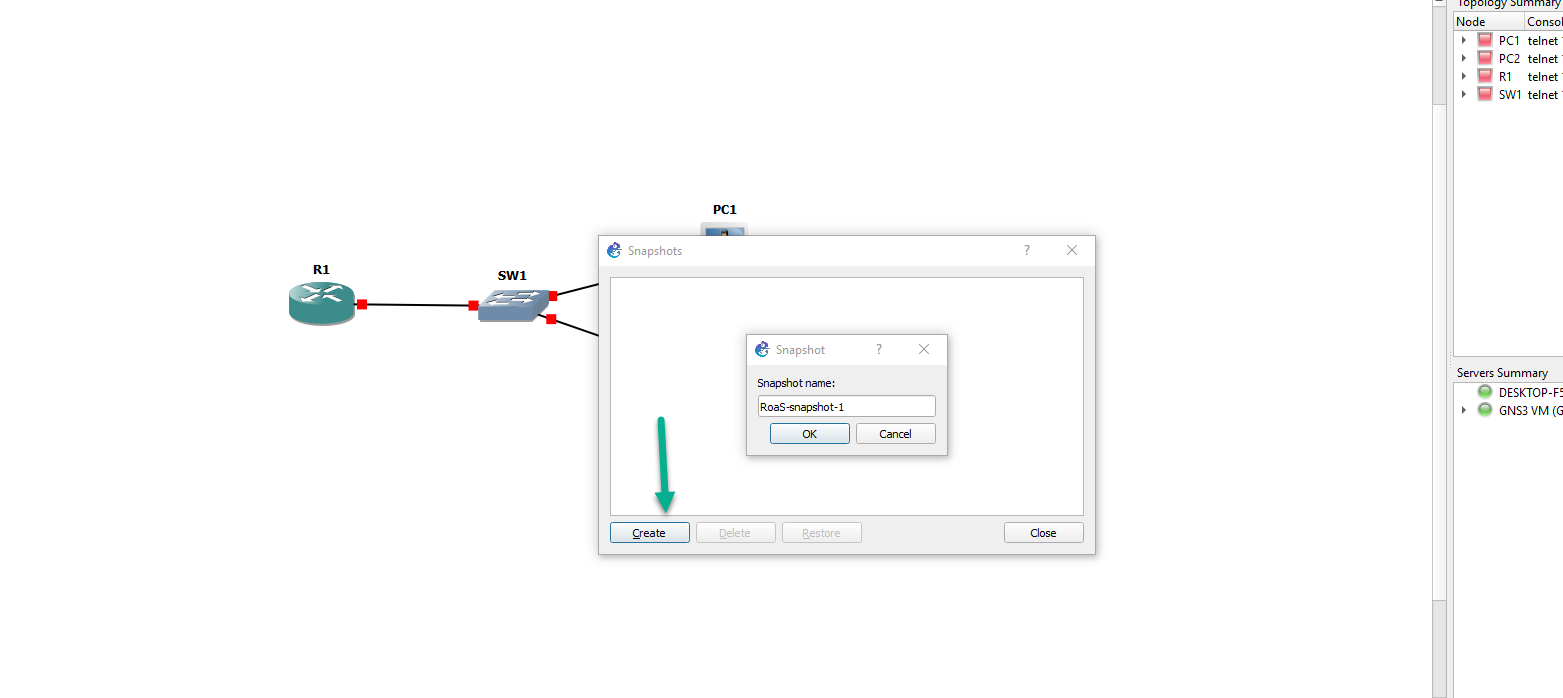
Give the Snapshot a unique name, and click OK.
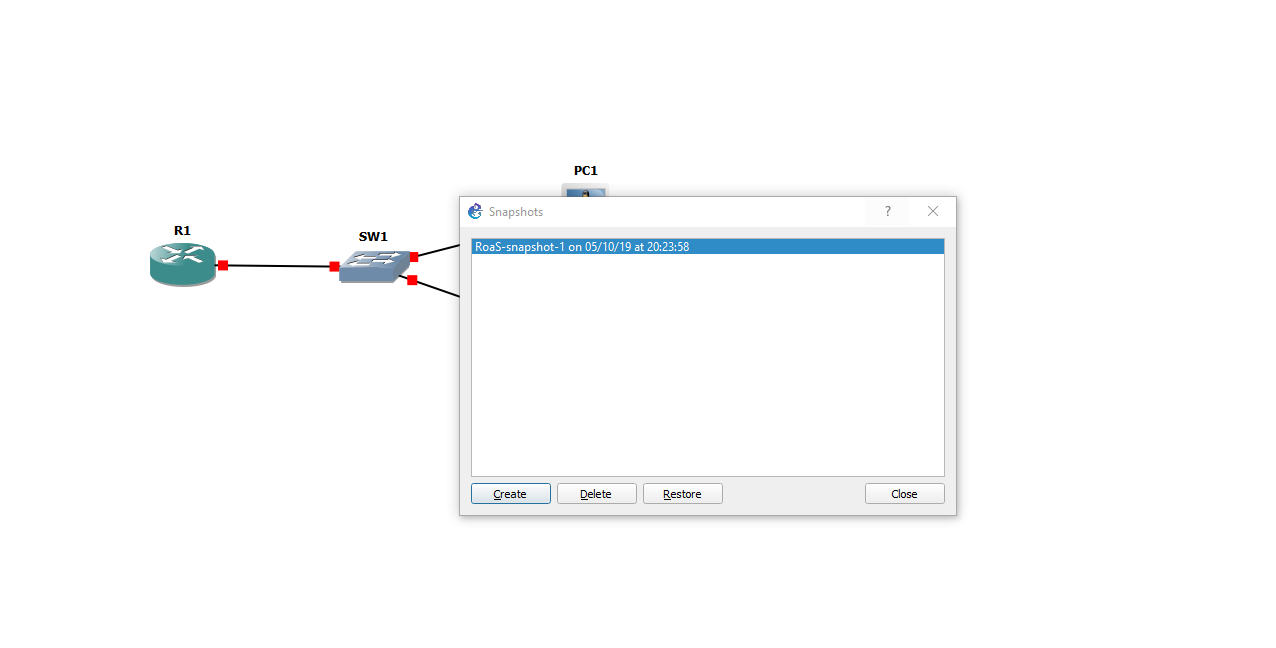
The newly created Snapshot will be displayed by name, along with the creation date & time in DD/MM/YY and 24hr formats.
Snapshots are stored on a per-project basis, so in order to restore a Snapshot of project ospf-2.gns3 (for example), you’d need to already have that project open.
Click ‘Close’ to exit this pop-up window.
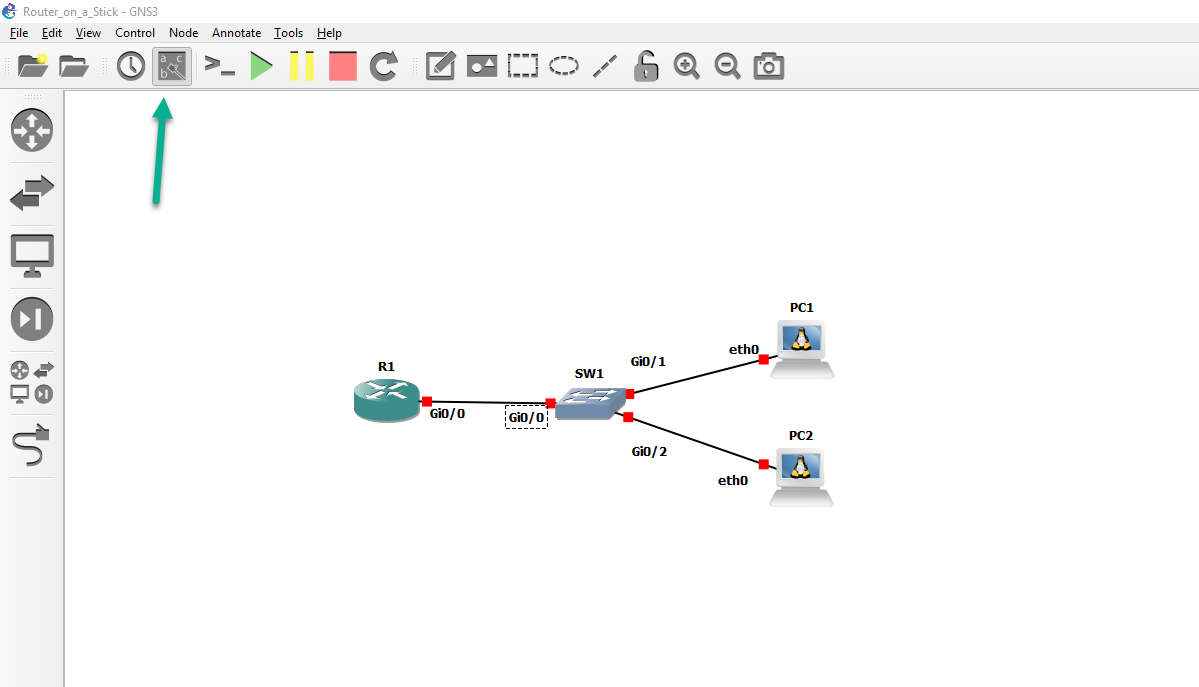
Show/Hide Interface Labels
Click the Show/Hide interface labels button to display or hide interface labels in your GNS3 projects. The button will toggle the displaying or hiding of abbreviated interface names. For example interface FastEthernet 0/0 is displayed as f0/0 in GNS3.
Default By default, interface labels are hidden.
To display interface labels click the Show/Hide interface labels button on the GNS3 Toolbar:
Result Interface labels are displayed in devices in the workspace. The button also displays as depressed:
Click the Show/Hide interface labels button again to hide the labels.
Console Connect to all Devices
The console connect button on the toolbar will open connections to each running device in your topology using whichever terminal emulation program you have selected in GNS3’s global preferences.
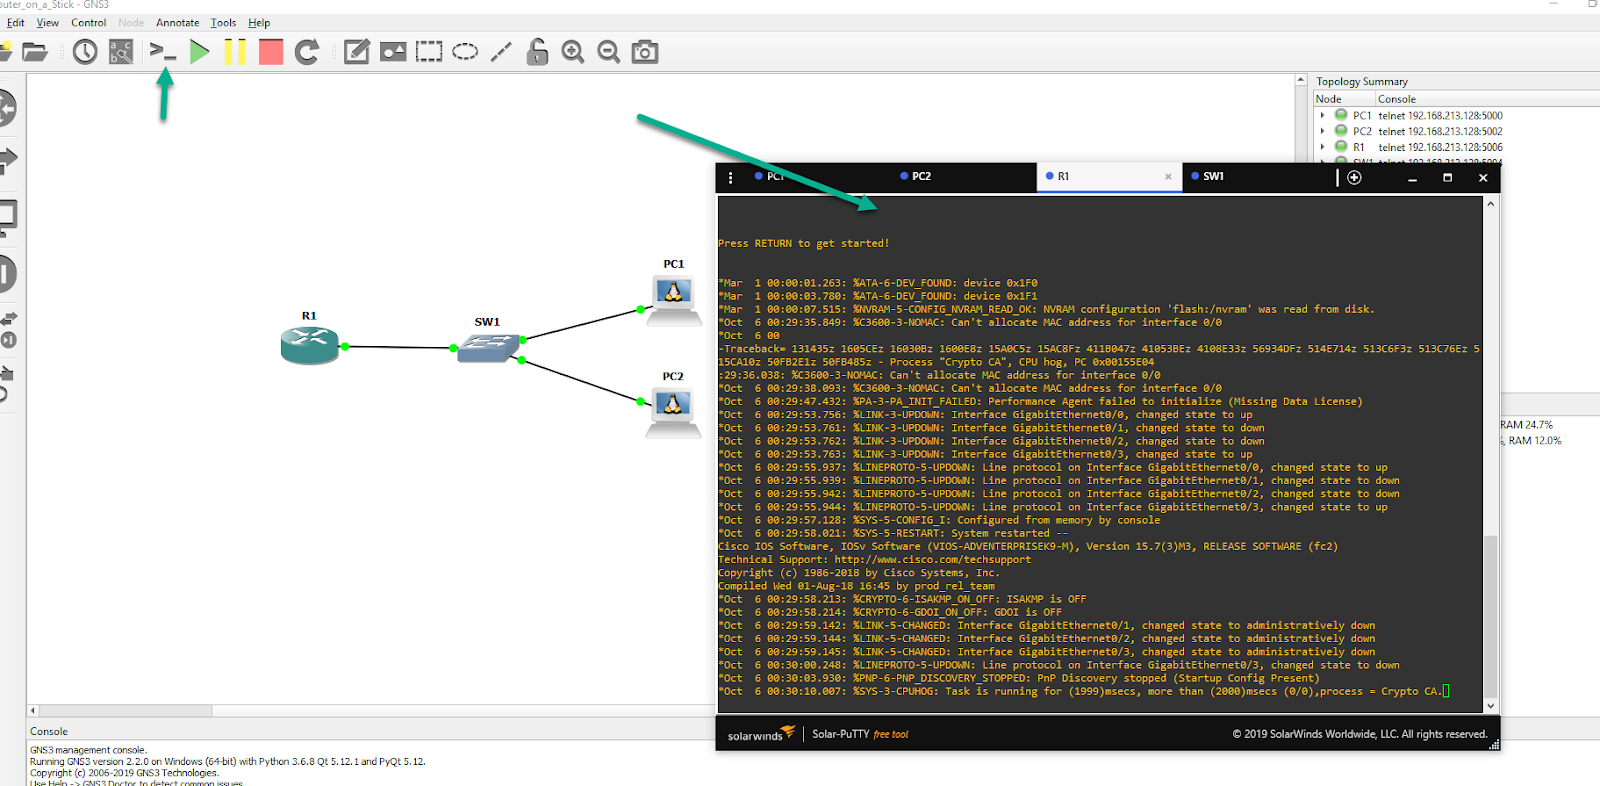
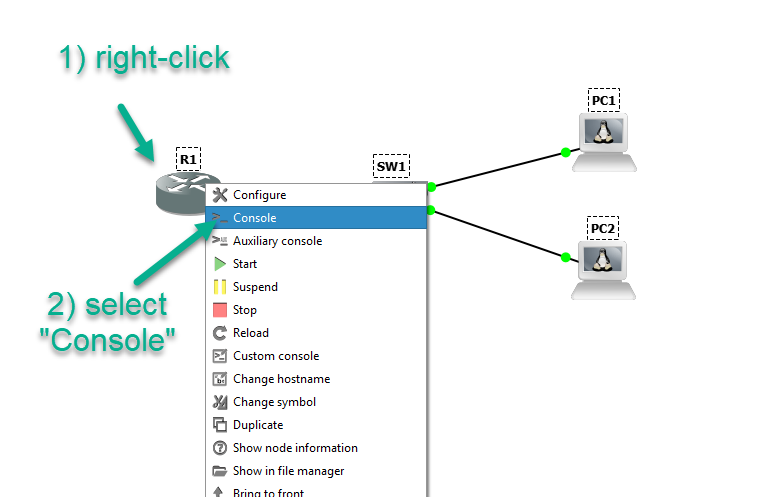
The following isn’t a Toolbar button, but you can elect to open console connections to a subset of topology devices by selecting them in the workspace, right-clicking, and left-clicking on “Console” in the pop-up menu
Third GNS3 Toolbar Group
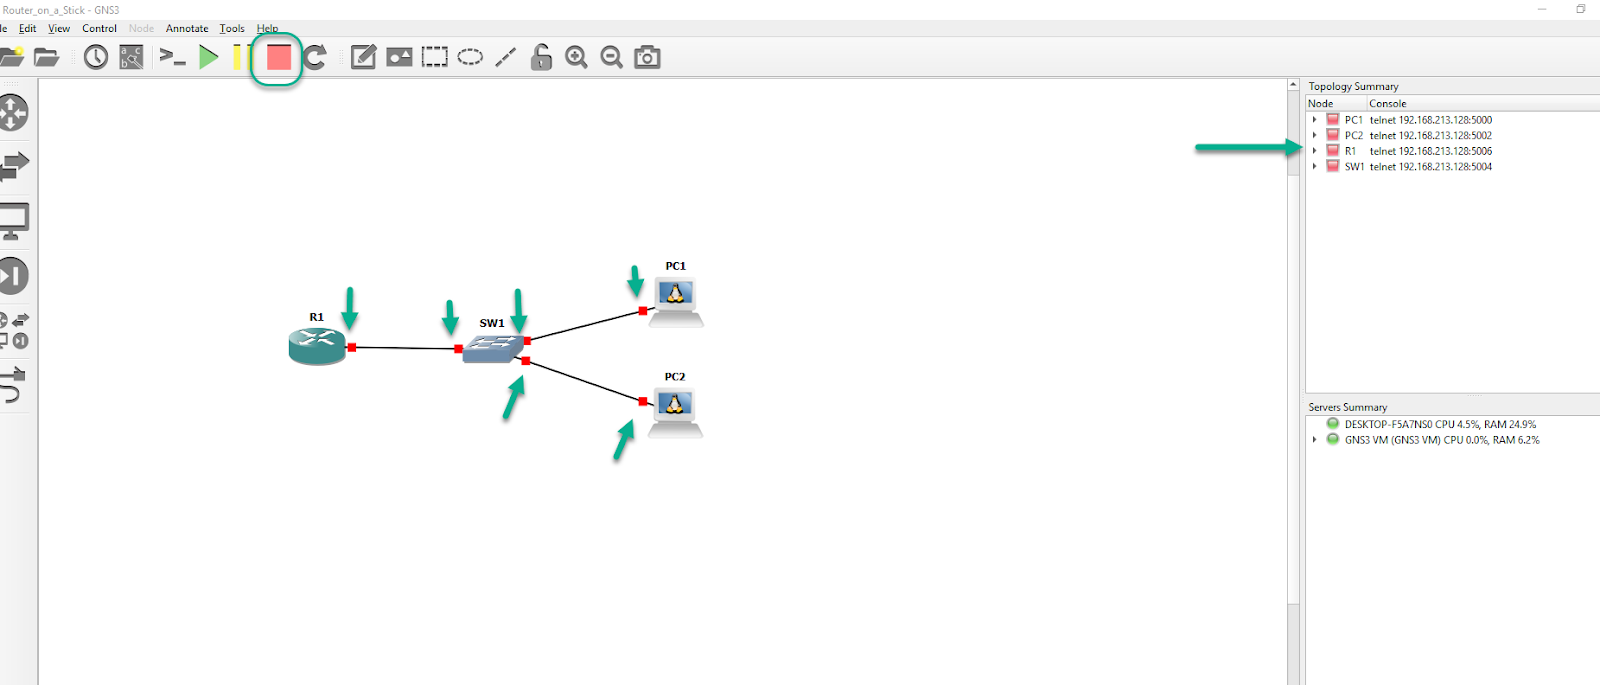
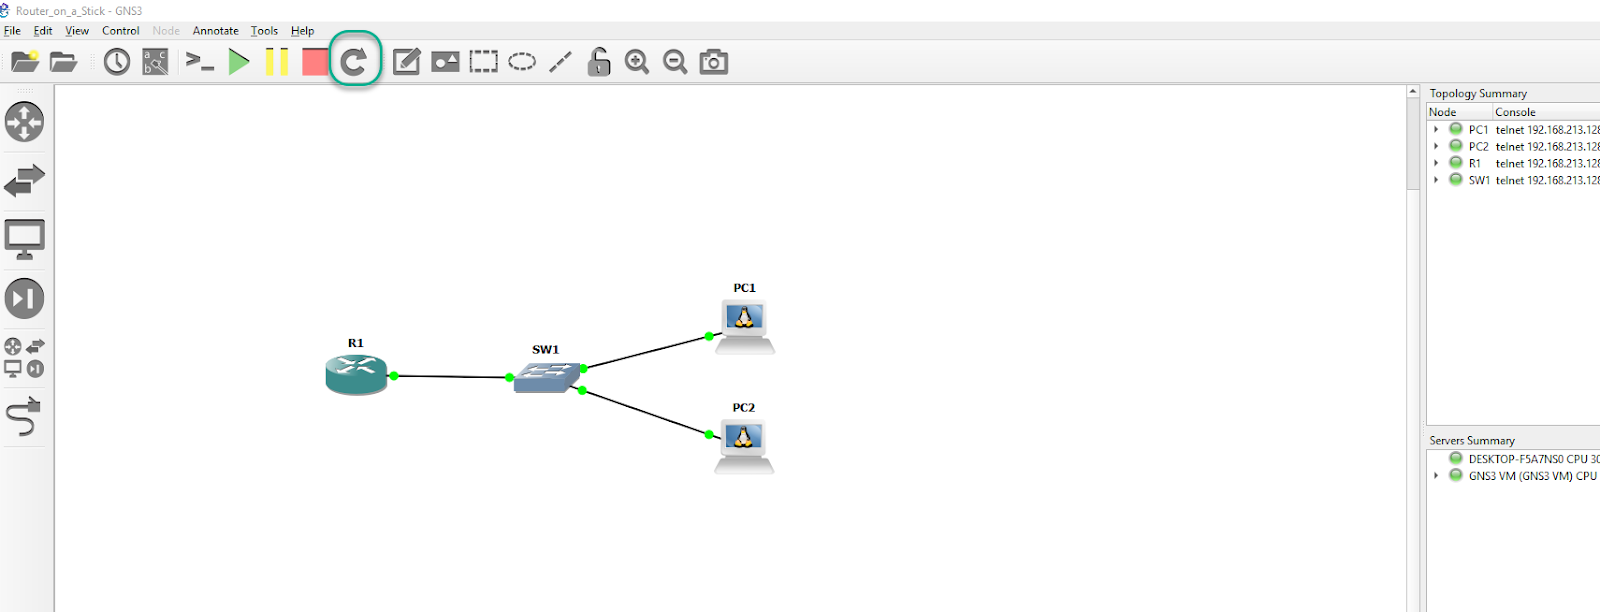
The third GNS3 Toolbar Group allows you to Start, Suspend, Stop, and Restart all the topology devices at once.
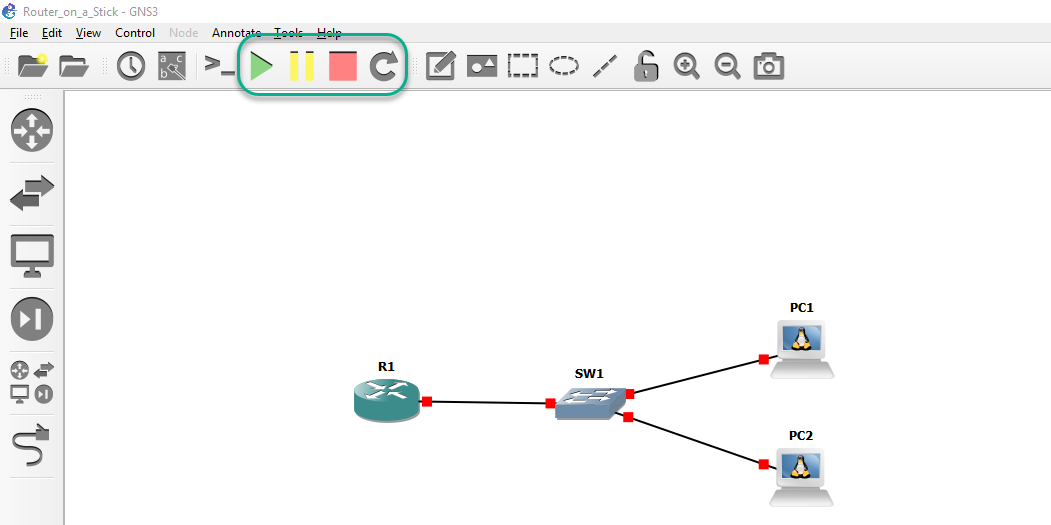
The buttons themselves are pretty self-explanatory, but you will notice both in the Workspace and Topology Summary panes that the indicators will change color for devices that are running, suspended, or stopped (restarted devices switch to Started, and you’ll see them reload in any open console connection).
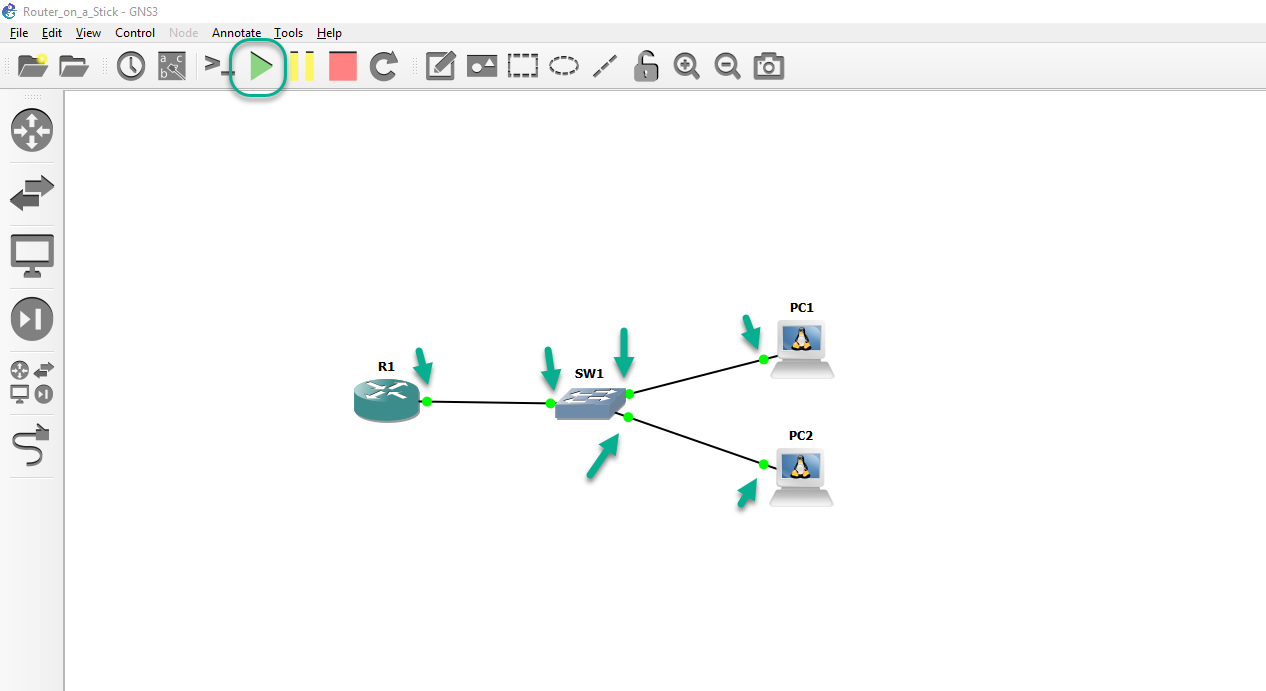
The Start button will power on every device in the Workspace, and the indicators on the links will turn green.
You can also verify the status of each link in the Topology Summary, to the right:
The link indicators for Suspended devices will turn yellow. Suspended devices still have any non-saved configuration changes stored in your system RAM, and while switch to a powered on state faster than stopped devices will (again, this will also be reflected in the Topology Summary). Stopped devices have their link indicators turn red, and are fully powered off. You’ll need to either click the Start or Restart buttons to turn them back on.
The Restart button is just to the right of the Stop button:
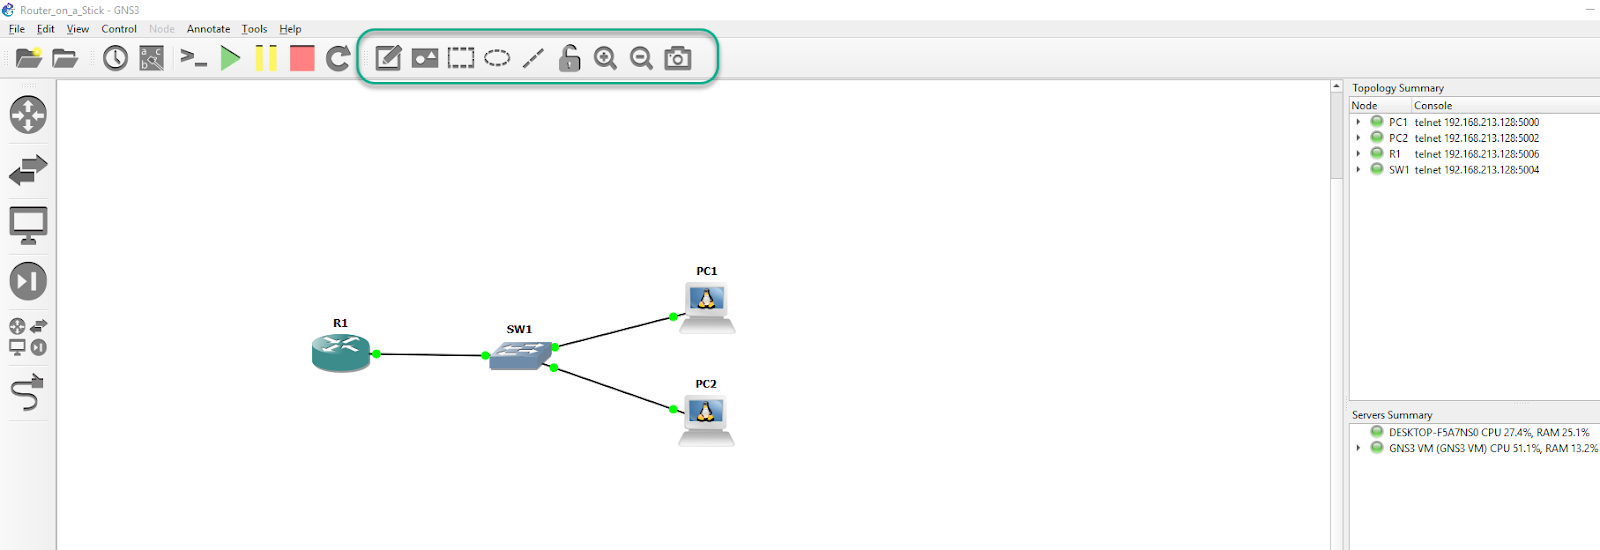
Fourth GNS3 Toolbar Group
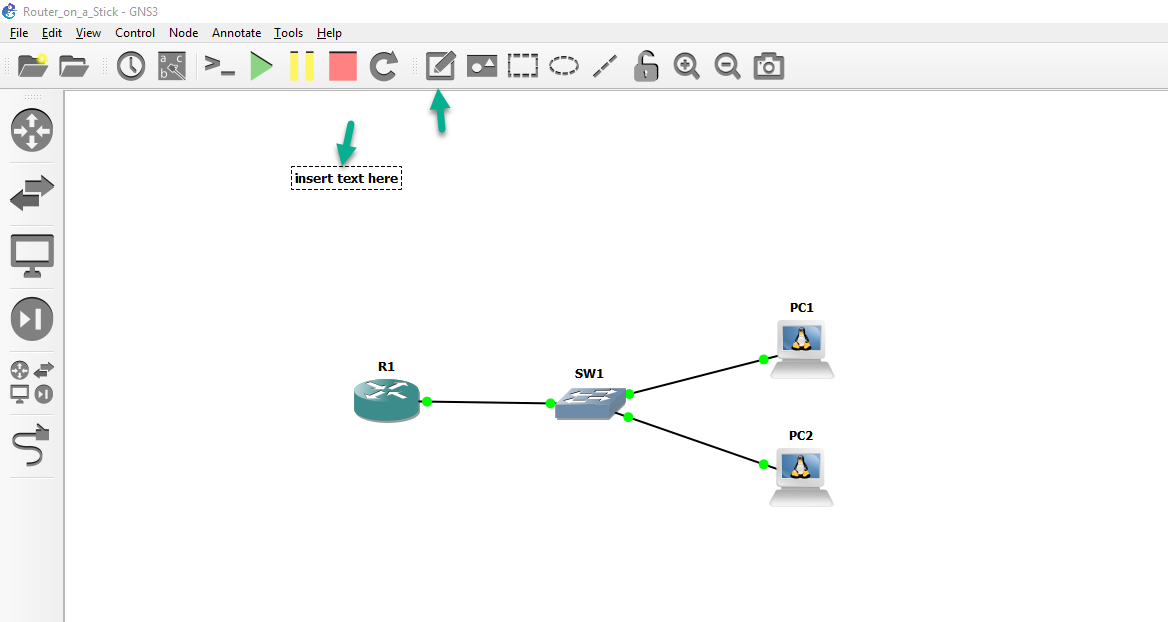
The fourth GNS3 Toolbar Group allows you to annotate notes into the topology Workspace, import an image to serve as a background, add shapes and lines, as well as zoom in/out, or take a screenshot of the Workspace
Annotate allows you to add notes in the Workspace related to your topology (to make it easier to remember when coming back to it later, instead of viewing the config files of each device).
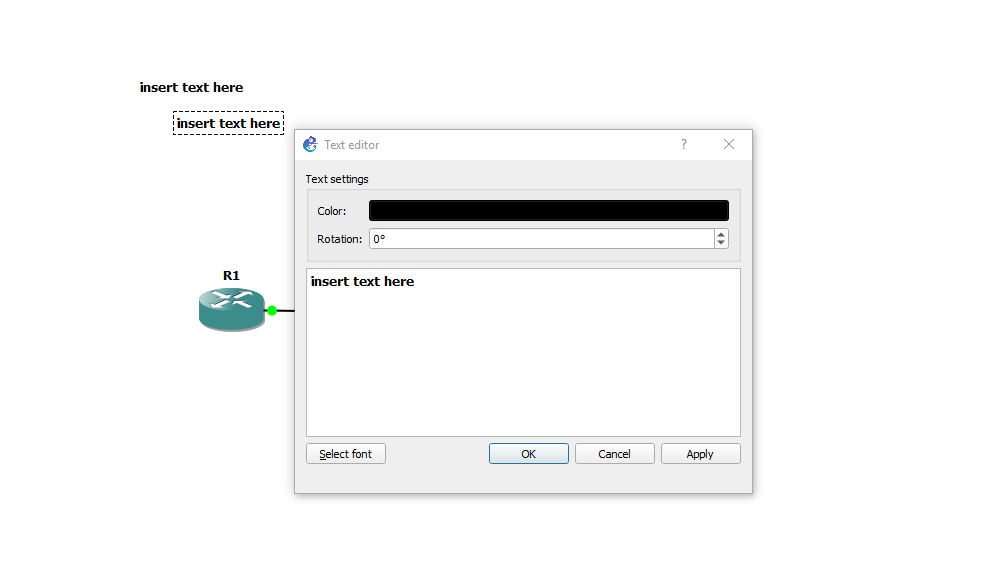
If you right-click on the current text box, you’ll get options to duplicate the text (comes in handy of you’re adding IP addressing to a large topology, raising/lowering the text a layer, as well as Text edit. Text edit gives you the ability to change the text color, font, font size, and orientation.
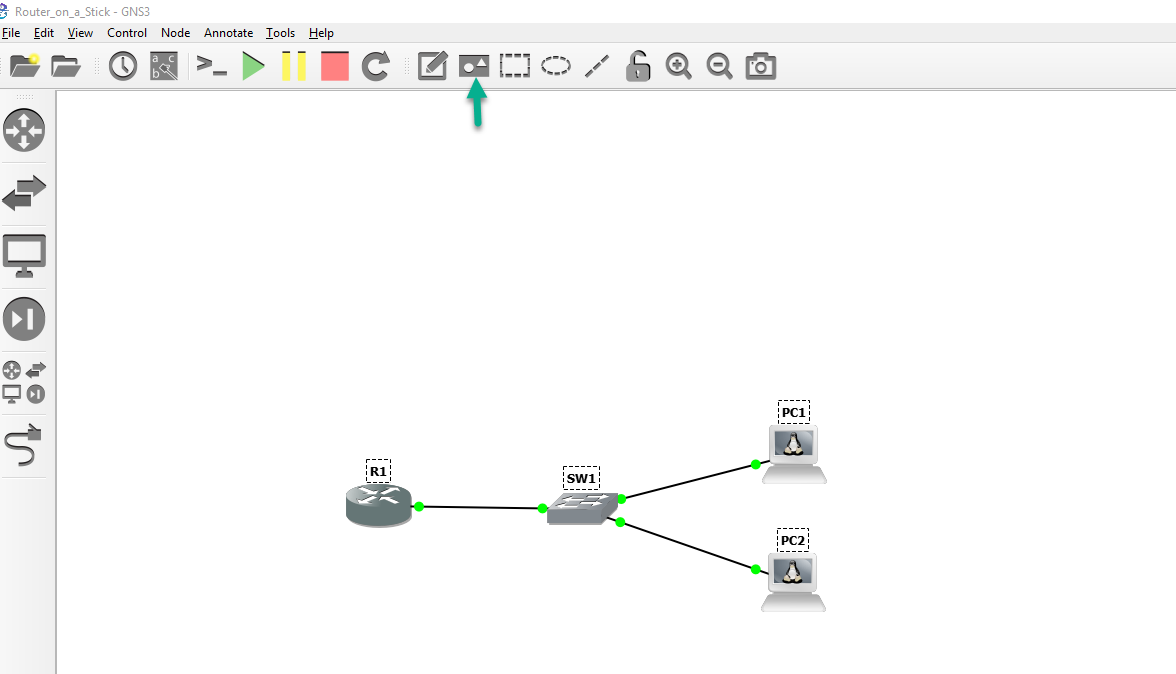
The background image button will allow to select an image (from the My Pictures folder by default) to import as the background image for the topology,
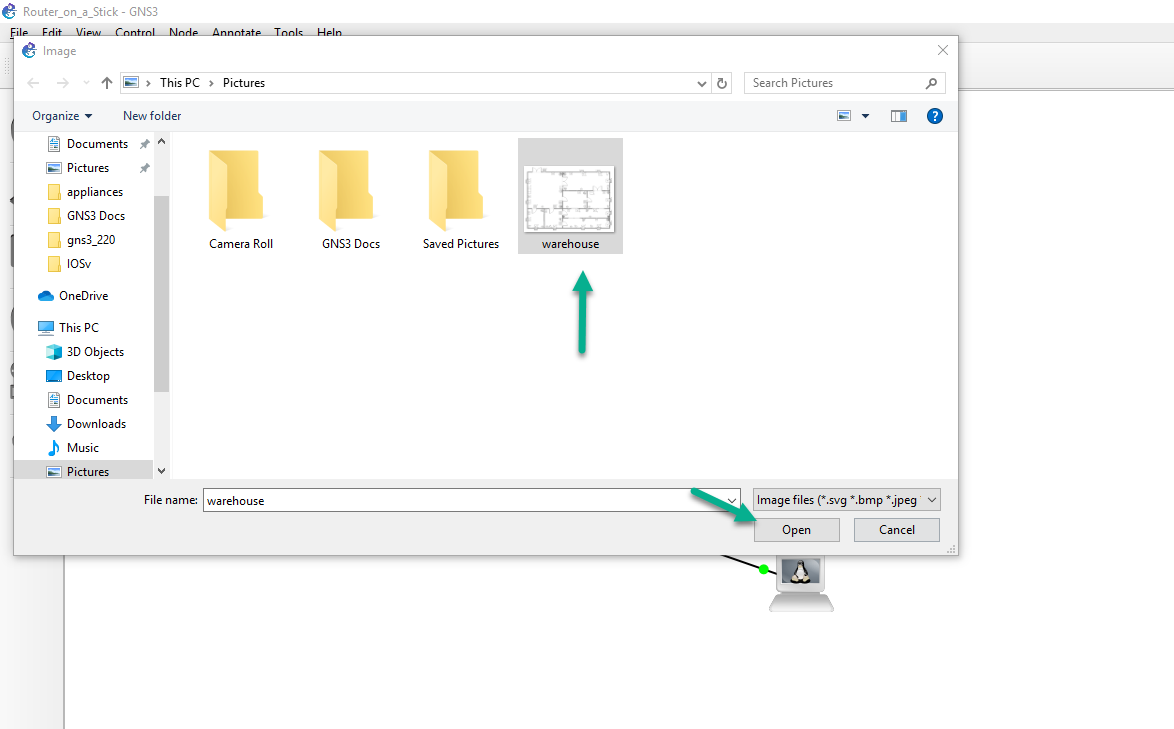
When the pop-up window opens, asking you which image you’d like to use as the topology background, select it, and click 'Open':
That image will be added as the background. Ideally, you’d use an image roughly the same size (or larger) than the topology you’re creating:
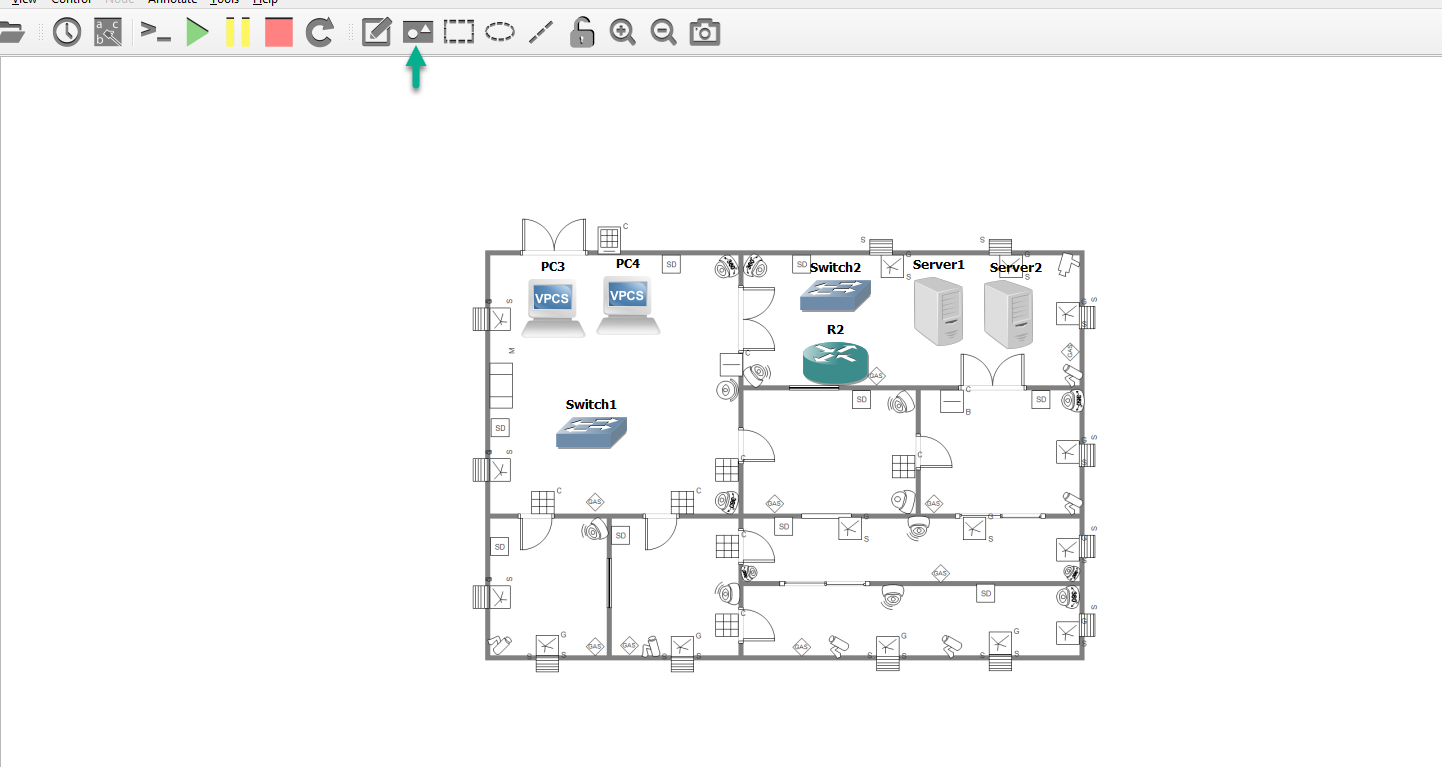
(obviously this background image was quite small, but it’s just here for illustration purposes)
The Circle, Square, and Line buttons allow you add and arbitrarily change the size/shape and color of those shapes that you add to a topology.

(the square shape is just shown as an example, since the other two have similar options).
You can also right-click and duplicate those, like you can with text annotations:
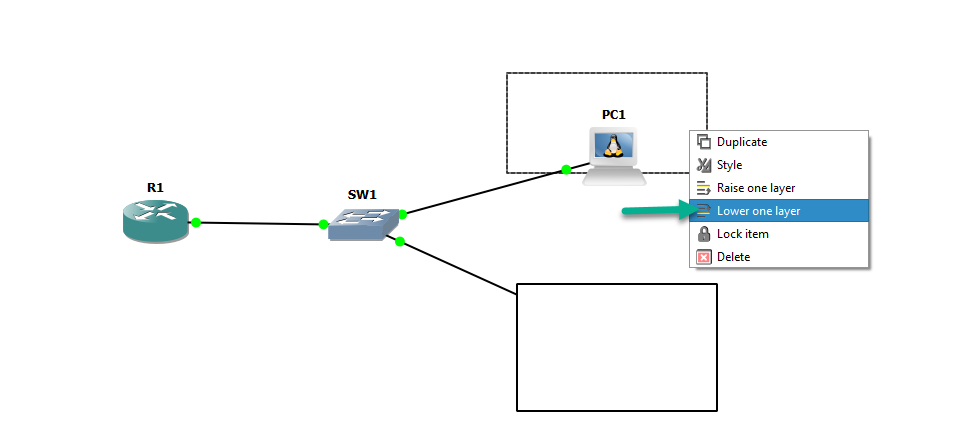
Something to bear in mind, is that these shapes will initially be placed on a higher layer than devices already in the topology workspace, so they’ll obscure devices already present:
Right-click on the object, and select “Lower one layer” to place it on a layer lower than the device(s) in the topology:

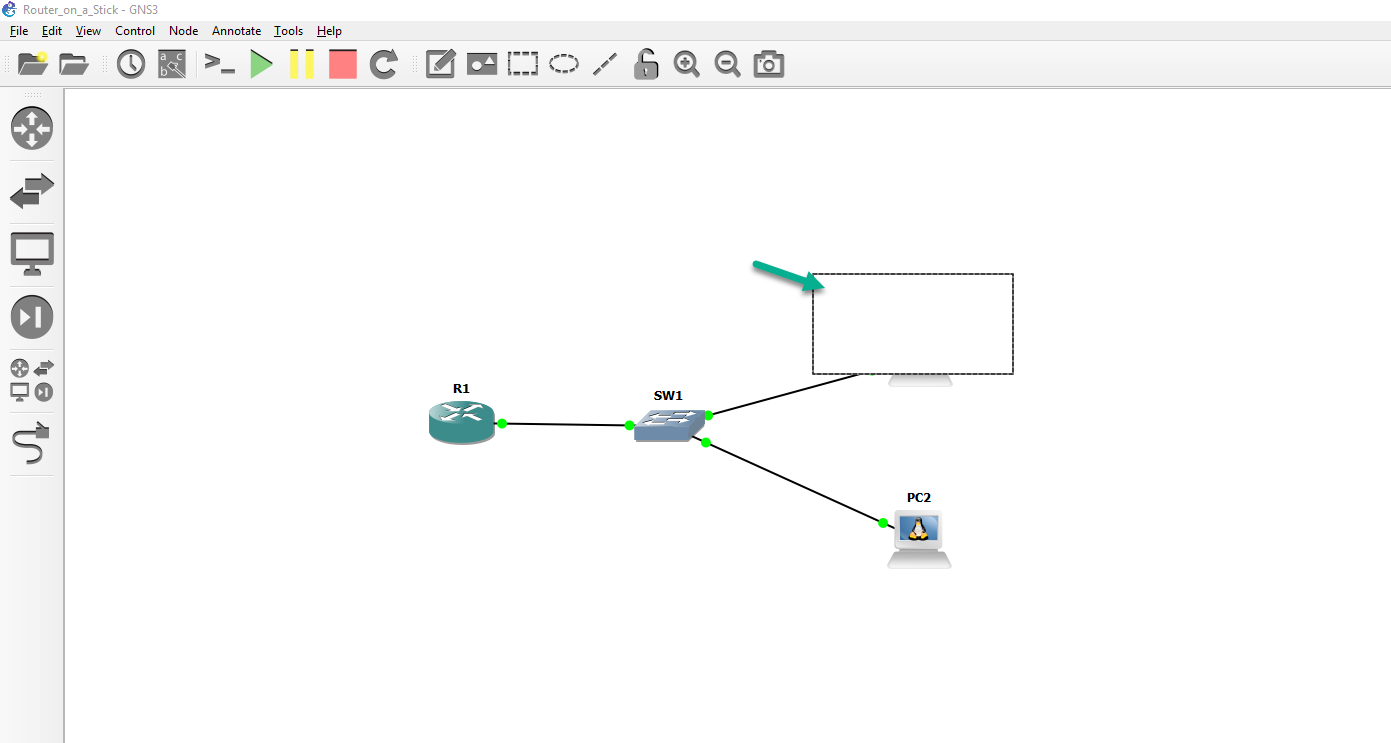
Once you’ve dropped these shapes down a couple of layers they become non-editable, so you’ll need to raise them to higher layers to manipulate them further, or just delete them (accomplished by right-clicking on them, and choosing “Raise one layer”).
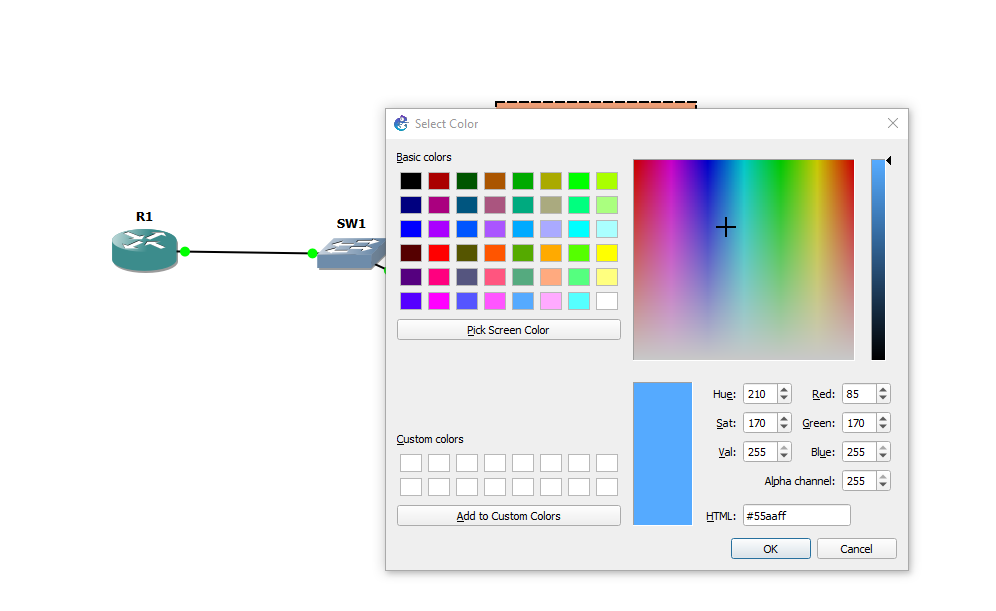
You can right-click on them just like a text box to get similar options, but you’d choose “Style” instead of text edit:
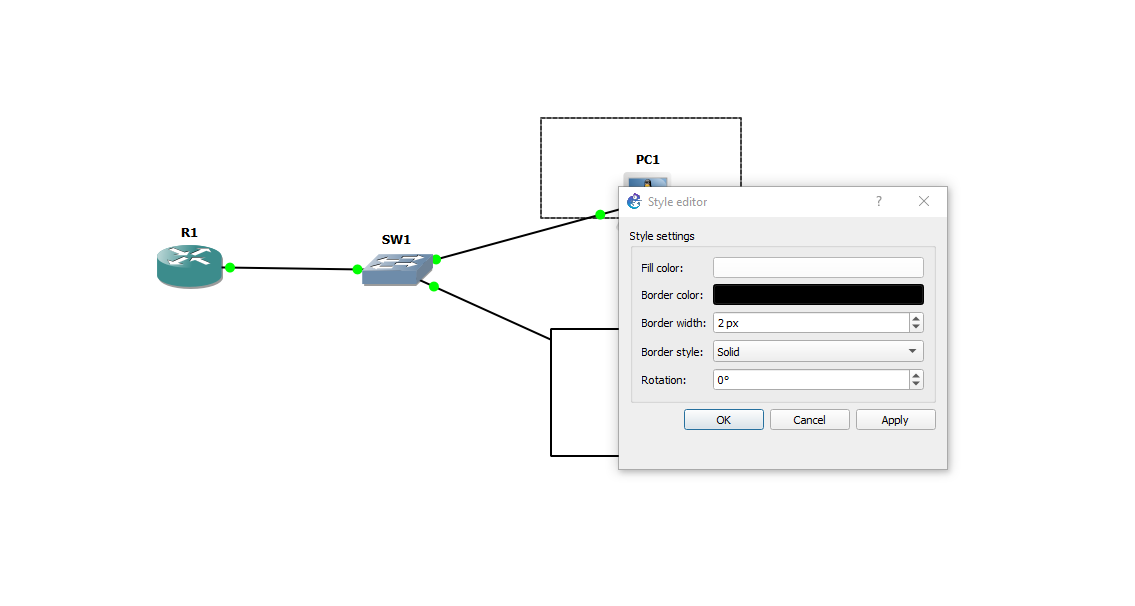
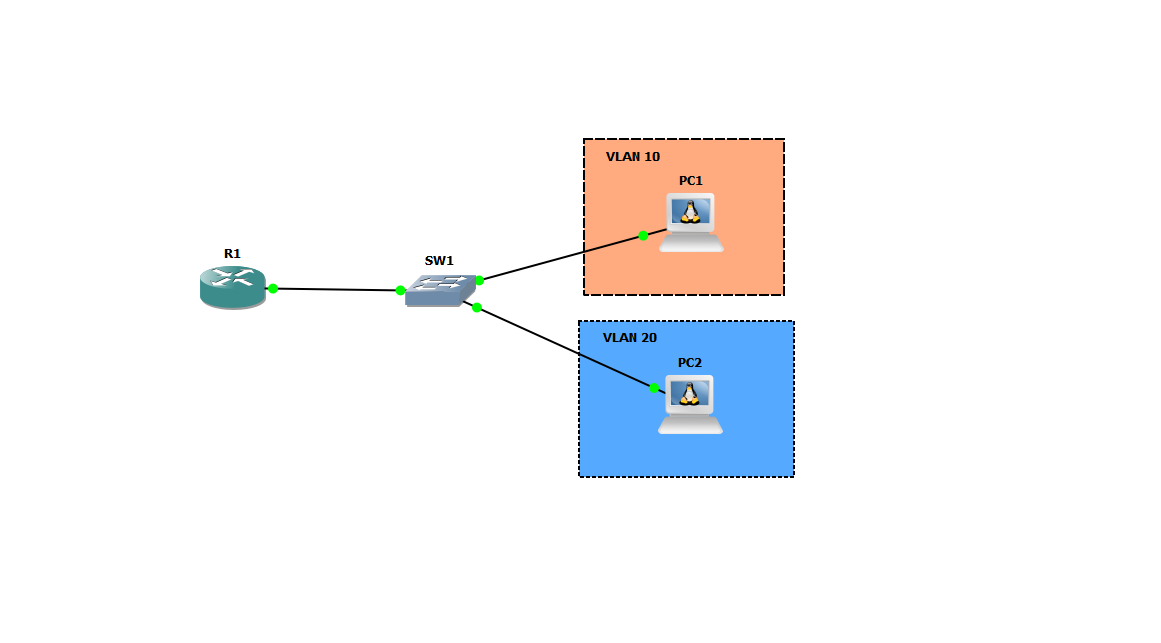
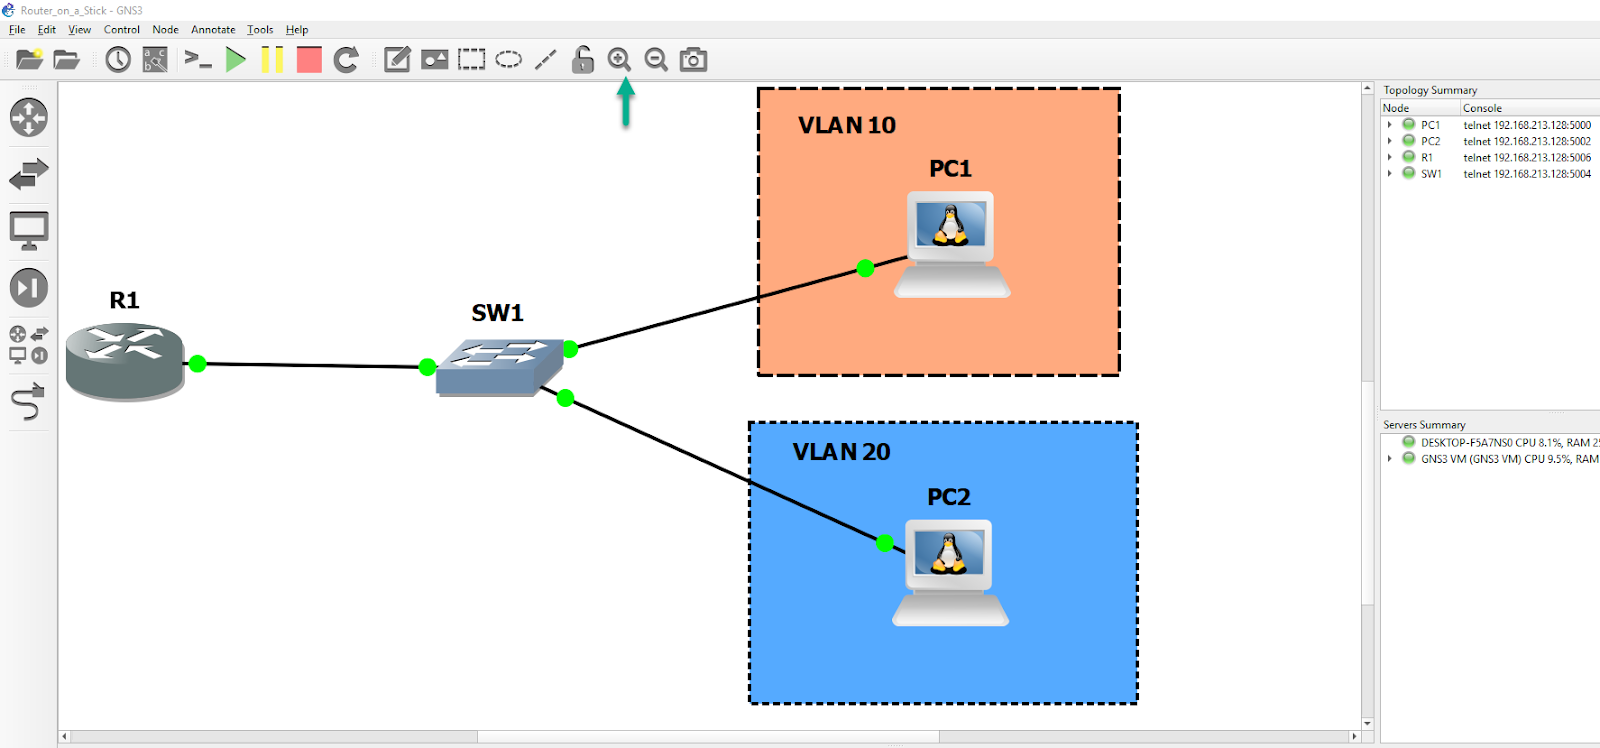
You can change the objects fill color, border color, border width, border type, and rotation. In the two below images, the fill color and border type of two squares have been changed, to indicate they’re in different VLANs:
The final three buttons are pretty self explanatory. The first magnifying glass (with the plus (+) sign) will zoom in the topology view:
The magnifying glass with glass with the minus ( - ) sign will zoom out the topology view:
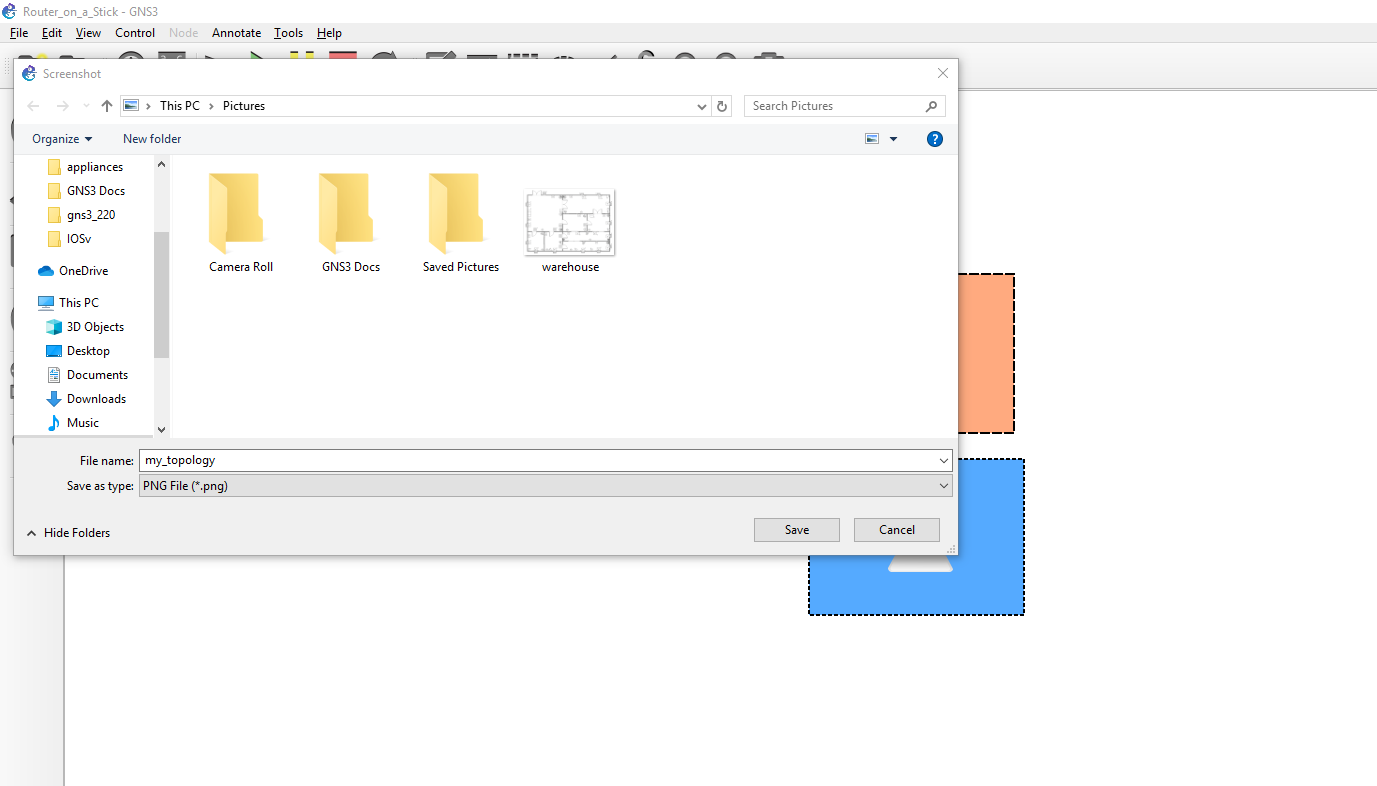
The snapshot button (looks like a little camera) will take a image of the entire topology (not just the currently visible area), and save it in your default images folder. It will use the topology name for the filename by default, but you can change that: